U-Haul 2011 Annual Report Download - page 3
Download and view the complete annual report
Please find page 3 of the 2011 U-Haul annual report below. You can navigate through the pages in the report by either clicking on the pages listed below, or by using the keyword search tool below to find specific information within the annual report.-
 1
1 -
 2
2 -
 3
3 -
 4
4 -
 5
5 -
 6
6 -
 7
7 -
 8
8 -
 9
9 -
 10
10 -
 11
11 -
 12
12 -
 13
13 -
 14
14 -
15
-
16
-
17
-
18
-
19
-
20
-
21
-
22
-
23
-
24
-
25
-
26
-
27
-
28
-
29
-
30
-
31
-
32
-
33
-
34
-
35
-
36
-
37
-
38
-
39
-
40
-
41
-
42
-
43
-
44
-
45
-
46
-
47
-
48
-
49
-
50
-
51
-
52
-
53
-
54
-
55
-
56
-
57
-
58
-
59
-
60
-
61
-
62
-
63
-
64
-
65
-
66
-
67
-
68
-
69
-
70
-
71
-
72
-
73
-
74
-
75
-
76
-
77
-
78
-
79
-
80
-
81
-
82
-
83
-
84
-
85
-
86
-
87
-
88
-
89
-
90
-
91
-
92
-
93
-
94
-
95
-
96
-
97
-
98
-
99
-
100
-
101
-
102
-
103
-
104
-
105
-
106
-
107
-
108
-
109
-
110
-
111
-
112
-
113
-
114
-
115
-
116
-
117
-
118
-
119
-
120
-
121
-
122
-
123
-
124
-
125
-
126
 |
 |

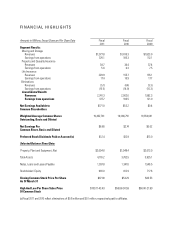
Amounts in Millions, Except Share and Per Share Data Fiscal Fiscal Fiscal
2011 2010 2009
Segment Results:
Moving and Storage
Revenues $1,977.8 $1,816.3 $1,823.0
Earnings from operations 370.1 185.3 112.1
Property and Casualty Insurance
Revenues 38.7 34.4 37.4
Earnings from operations 5.6 6.3 7.5
Life Insurance
Revenues 229.9 155.7 135.1
Earnings from operations 17.4 16.9 17.7
Eliminations
Revenues (5.1) (4.4) (3.3)
Earnings from operations (15.5) (14.9) (16.3)
Consolidated Results
Revenues 2,241.3 2,002.0 1,992.3
Earnings from operations 377.7 193.5 121.0
Net Earnings Available to $171.0 $53.2 $0.4
Common Shareholders
Weighted Average Common Shares 19,432,781 19,386,791 19,350,041
Outstanding, Basic and Diluted
Net Earnings Per $8.80 $2.74 $0.02
Common Share, Basic and Diluted
Preferred Stock Dividends Paid or Accrued (a) $12.4 $12.9 $13.0
Selected Balance Sheet Data:
Property, Plant and Equipment, Net $2,094.6 $1,948.4 $2,013.9
Total Assets 4,176.2 3,762.5 3,825.1
Notes, Loans and Leases Payable 1,397.8 1,347.6 1,546.5
Stockholders’ Equity 993.0 812.9 717.6
Closing Common Stock Price Per Share $97.00 $54.29 $33.53
As Of March 31
High And Low Per Share Sales Price $109.11-43.43 $56.88-30.59 $60.00-21.89
Of Common Stock
(a) Fiscal 2011 and 2010 reflect eliminations of $0.6 million and $0.1 million, respectively paid to affiliates.
FINANCIAL HIGHLIGHTS