U-Haul 2011 Annual Report Download - page 62
Download and view the complete annual report
Please find page 62 of the 2011 U-Haul annual report below. You can navigate through the pages in the report by either clicking on the pages listed below, or by using the keyword search tool below to find specific information within the annual report.-
 1
1 -
2
-
3
-
4
-
5
-
6
-
7
-
8
-
9
-
10
-
11
-
12
-
13
-
14
-
15
-
16
-
17
-
18
-
19
-
20
-
21
-
22
-
23
-
24
-
25
-
26
-
27
-
28
-
29
-
30
-
31
-
32
-
33
-
34
-
35
-
36
-
37
-
38
-
39
-
40
-
41
-
42
-
43
-
44
-
45
-
46
-
47
-
48
-
49
-
50
-
51
-
 52
52 -
 53
53 -
 54
54 -
 55
55 -
 56
56 -
 57
57 -
 58
58 -
 59
59 -
 60
60 -
 61
61 -
 62
62 -
 63
63 -
 64
64 -
 65
65 -
 66
66 -
 67
67 -
 68
68 -
 69
69 -
 70
70 -
 71
71 -
 72
72 -
73
-
74
-
75
-
76
-
77
-
78
-
79
-
80
-
81
-
82
-
83
-
84
-
85
-
86
-
87
-
88
-
89
-
90
-
91
-
92
-
93
-
94
-
95
-
96
-
97
-
98
-
99
-
100
-
101
-
102
-
103
-
104
-
105
-
106
-
107
-
108
-
109
-
110
-
111
-
112
-
113
-
114
-
115
-
116
-
117
-
118
-
119
-
120
-
121
-
122
-
123
-
124
-
125
-
126
 |
 |

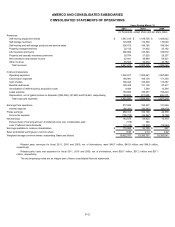
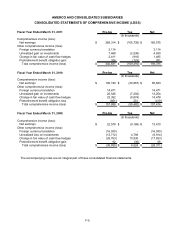
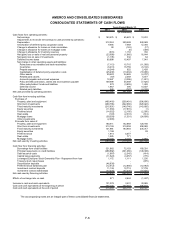
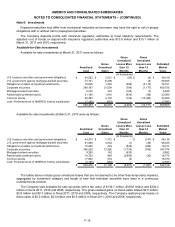
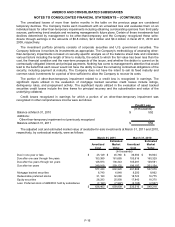
AMERCO AND CONSOLIDATED SUBSIDIARIES
CONSOLIDATED STATEMENTS OF CASH FLOWS
2011 2010 2009
Cash flows from operating activities:
Net earnings $ 183,575 $ 65,623 $ 13,410
Adjustments to reconcile net earnings to cash provided by operations:
Depreciation 212,324 229,589 248,569
Amortization of deferred policy acquisition costs 9,494 7,569 12,394
Change in allowance for losses on trade receivables 28 (163) (17)
Change in allowance for losses on mortgage notes - (6) (309)
Change in allowance for inventory reserves (674) 1,153 792
Net (gain) loss on sale of real and personal property (23,058) (1,960) 16,644
Net (gain) loss on sale of investments (1,135) 332 64
Deferred income taxes 80,898 15,497 7,941
Net change in other operating assets and liabilities:
Reinsurance recoverables and trade receivables (7,113) 15,715 (11,069)
Inventories (6,431) 16,759 (6,192)
Prepaid expenses (4,244) 822 2,428
Capitalization of deferred policy acquisition costs (25,239) (13,934) (10,906)
Other assets 29,522 34,626 (4,797)
Related party assets (87) 2,369 4,577
Accounts payable and accrued expenses 12,547 (3,096) (1,821)
Policy benefits and losses, claims and loss expenses payable 109,599 34,589 (7,620)
Other policyholders' funds and liabilities 572 (3,805) 1,493
Deferred income 1,967 396 13,037
Related party liabilities 249 (727) (4,192)
Net cash provided by operating activities 572,794 401,348 274,426
Cash flow from investing activities:
Purchase of:
Property, plant and equipment (480,418) (259,491) (396,690)
Short term investments (260,766) (322,666) (320,922)
Fixed maturity investments (215,931) (149,746) (143,665)
Equity securities (11,550) (17,815) (1)
Preferred stock (14,352) (2,185) (2,000)
Real estate (193) (2,310) (614)
Mortgage loans (38,558) (1,501) (24,699)
Other investments (2,000) - -
Proceeds from sales of:
Property, plant and equipment 180,411 142,869 128,188
Short term investments 310,195 319,258 298,982
Fixed maturity investments 131,981 163,654 234,317
Equity securities 1,198 - 28
Preferred stock 1,914 5,077 -
Real estate 1,925 771 -
Mortgage loans 15,156 6,107 5,884
Net cash used by investing activities (380,988) (117,978) (221,192)
Cash flow from financing activities:
Borrowings from credit facilities 321,862 72,153 180,331
Principal repayments on credit facilities (288,882) (301,966) (148,398)
Debt issuance costs (1,987) (2,345) (414)
Capital lease payments (11,522) (4,057) (776)
Leveraged Employee Stock Ownership Plan - Repayment from loan 1,172 1,111 1,230
Treasury stock repurchases - - (976)
Securitization deposits (46,838) - -
Preferred stock dividends paid (12,412) (12,856) (12,963)
Investment contract deposits 11,138 12,712 17,739
Investment contract withdrawals (33,230) (47,235) (53,605)
Net cash used by financing activities (60,699) (282,483) (17,832)
Effects of exchange rate on cash 271 2,644 (1,437)
Increase in cash and cash equivalents 131,378 3,531 33,965
Cash and cash equivalents at the beginning of period 244,118 240,587 206,622
Cash and cash equivalents at the end of period
$
375,496
$
244,118
$
240,587
(In thousands)
Years Ended March 31,
The accompanying notes are an integral part of these consolidated financial statements.
F-6