U-Haul 2011 Annual Report Download - page 19
Download and view the complete annual report
Please find page 19 of the 2011 U-Haul annual report below. You can navigate through the pages in the report by either clicking on the pages listed below, or by using the keyword search tool below to find specific information within the annual report.-
 1
1 -
2
-
3
-
4
-
5
-
6
-
7
-
8
-
 9
9 -
 10
10 -
 11
11 -
 12
12 -
 13
13 -
 14
14 -
 15
15 -
 16
16 -
 17
17 -
 18
18 -
 19
19 -
 20
20 -
 21
21 -
 22
22 -
 23
23 -
 24
24 -
 25
25 -
 26
26 -
 27
27 -
 28
28 -
 29
29 -
30
-
31
-
32
-
33
-
34
-
35
-
36
-
37
-
38
-
39
-
40
-
41
-
42
-
43
-
44
-
45
-
46
-
47
-
48
-
49
-
50
-
51
-
52
-
53
-
54
-
55
-
56
-
57
-
58
-
59
-
60
-
61
-
62
-
63
-
64
-
65
-
66
-
67
-
68
-
69
-
70
-
71
-
72
-
73
-
74
-
75
-
76
-
77
-
78
-
79
-
80
-
81
-
82
-
83
-
84
-
85
-
86
-
87
-
88
-
89
-
90
-
91
-
92
-
93
-
94
-
95
-
96
-
97
-
98
-
99
-
100
-
101
-
102
-
103
-
104
-
105
-
106
-
107
-
108
-
109
-
110
-
111
-
112
-
113
-
114
-
115
-
116
-
117
-
118
-
119
-
120
-
121
-
122
-
123
-
124
-
125
-
126
 |
 |

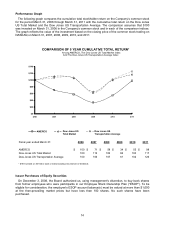
Performance Graph
The following graph compares the cumulative total stockholder return on the Company’s common stock
for the period March 31, 2006 through March 31, 2011 with the cumulative total return on the Dow Jones
US Total Market and the Dow Jones US Transportation Average. The comparison assumes that $100
was invested on March 31, 2006 in the Company’s common stock and in each of the comparison indices.
The graph reflects the value of the investment based on the closing price of the common stock trading on
NASDAQ on March 31, 2007, 2008, 2009, 2010, and 2011.
COMPARISON OF 5 YEAR CUMULATIVE TOTAL RETURN*
A
mong AMERCO, The Dow Jones US Total Market Index
And The Dow Jones US Transportation Average Index
$0
$20
$40
$60
$80
$100
$120
$140
3/06 3/07 3/08 3/09 3/10 3/11
AMERCO Dow Jones US
Total Market
Dow Jones US
Transportation Average
Fiscal year ended March 31: 2006 2007 2008 2009 2010 2011
AMERCO $ 100 $ 71 $ 58 $ 34 $ 55 $ 98
Dow Jones US Total Market 100 112 106 66 100 117
Dow Jones US Transportation Average 100 106 107 61 102 126
* $100 invested on 3/31/06 in stock or index-including reinvestment of dividends.
Issuer Purchases of Equity Securities
On December 3, 2008, the Board authorized us, using management’s discretion, to buy back shares
from former employees who were participants in our Employee Stock Ownership Plan (“ESOP”). To be
eligible for consideration, the employee’s ESOP account balance(s) must be valued at more than $1,000
at the then-prevailing market prices but have less than 100 shares. No such shares have been
purchased.
14