U-Haul 2011 Annual Report Download - page 31
Download and view the complete annual report
Please find page 31 of the 2011 U-Haul annual report below. You can navigate through the pages in the report by either clicking on the pages listed below, or by using the keyword search tool below to find specific information within the annual report.-
 1
1 -
2
-
3
-
4
-
5
-
6
-
7
-
8
-
9
-
10
-
11
-
12
-
13
-
14
-
15
-
16
-
17
-
18
-
19
-
20
-
 21
21 -
 22
22 -
 23
23 -
 24
24 -
 25
25 -
 26
26 -
 27
27 -
 28
28 -
 29
29 -
 30
30 -
 31
31 -
 32
32 -
 33
33 -
 34
34 -
 35
35 -
 36
36 -
 37
37 -
 38
38 -
 39
39 -
 40
40 -
 41
41 -
42
-
43
-
44
-
45
-
46
-
47
-
48
-
49
-
50
-
51
-
52
-
53
-
54
-
55
-
56
-
57
-
58
-
59
-
60
-
61
-
62
-
63
-
64
-
65
-
66
-
67
-
68
-
69
-
70
-
71
-
72
-
73
-
74
-
75
-
76
-
77
-
78
-
79
-
80
-
81
-
82
-
83
-
84
-
85
-
86
-
87
-
88
-
89
-
90
-
91
-
92
-
93
-
94
-
95
-
96
-
97
-
98
-
99
-
100
-
101
-
102
-
103
-
104
-
105
-
106
-
107
-
108
-
109
-
110
-
111
-
112
-
113
-
114
-
115
-
116
-
117
-
118
-
119
-
120
-
121
-
122
-
123
-
124
-
125
-
126
 |
 |

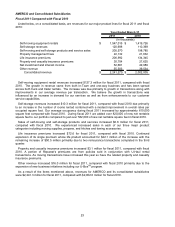
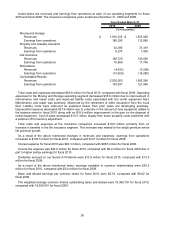
Listed below are revenues and earnings from operations at each of our operating segments for fiscal
2010 and fiscal 2009. The insurance companies years ended are December 31, 2009 and 2008.
2010 2009
Moving and storage
Revenues $ 1,816,322 $ 1,823,049
Earnings from operations 185,329 112,080
Property and casualty insurance
Revenues 34,390 37,419
Earnings from operations 6,279 7,505
Life insurance
Revenues 155,725 135,056
Earnings from operations 16,858 17,748
Eliminations
Revenues (4,432) (3,258)
Earnings from operations (14,929) (16,285)
Consolidated Results
Revenues 2,002,005 1,992,266
Earnings from operations 193,537 121,048
Year Ended March 31,
(In thousands)
Total costs and expenses decreased $62.8 million for fiscal 2010, compared with fiscal 2009. Operating
expenses for the Moving and Storage operating segment decreased $35.8 million due to improvement in
maintenance and repair costs and improved liability costs associated with the rental equipment fleet.
Maintenance and repair was positively influenced by the retirement of older equipment from the truck
fleet. Liability costs have improved as expected losses from prior years are developing positively.
Depreciation expense decreased $37.6 million due to a decline in the amount of new equipment added to
the balance sheet in fiscal 2010 along with an $18.6 million improvement in the gain on the disposal of
rental equipment. Cost of sales decreased $10.3 million largely from lower propane costs combined with
a positive LIFO inventory adjustment.
Total costs and expenses at the insurance companies increased $19.8 million primarily from an
increase in benefits in the life insurance segment. This increase was related to the single premium whole
life premium growth.
As a result of the above mentioned changes in revenues and expenses, earnings from operations
increased to $193.5 million for fiscal 2010, compared with $121.0 million for fiscal 2009.
Interest expense for fiscal 2010 was $93.3 million, compared with $98.5 million for fiscal 2009.
Income tax expense was $34.6 million for fiscal 2010, compared with $9.2 million for fiscal 2009 due in
part to higher pretax earnings for fiscal 2010.
Dividends accrued on our Series A Preferred were $12.9 million for fiscal 2010, compared with $13.0
million for fiscal 2009.
As a result of the above mentioned items, earnings available to common shareholders were $53.2
million for fiscal 2010, compared with $0.4 million for fiscal 2009.
Basic and diluted earnings per common share for fiscal 2010 were $2.74, compared with $0.02 for
fiscal 2009.
The weighted average common shares outstanding basic and diluted were 19,386,791 for fiscal 2010,
compared with 19,350,041 for fiscal 2009.
26