U-Haul 2011 Annual Report Download - page 116
Download and view the complete annual report
Please find page 116 of the 2011 U-Haul annual report below. You can navigate through the pages in the report by either clicking on the pages listed below, or by using the keyword search tool below to find specific information within the annual report.-
 1
1 -
2
-
3
-
4
-
5
-
6
-
7
-
8
-
9
-
10
-
11
-
12
-
13
-
14
-
15
-
16
-
17
-
18
-
19
-
20
-
21
-
22
-
23
-
24
-
25
-
26
-
27
-
28
-
29
-
30
-
31
-
32
-
33
-
34
-
35
-
36
-
37
-
38
-
39
-
40
-
41
-
42
-
43
-
44
-
45
-
46
-
47
-
48
-
49
-
50
-
51
-
52
-
53
-
54
-
55
-
56
-
57
-
58
-
59
-
60
-
61
-
62
-
63
-
64
-
65
-
66
-
67
-
68
-
69
-
70
-
71
-
72
-
73
-
74
-
75
-
76
-
77
-
78
-
79
-
80
-
81
-
82
-
83
-
84
-
85
-
86
-
87
-
88
-
89
-
90
-
91
-
92
-
93
-
94
-
95
-
96
-
97
-
98
-
99
-
100
-
101
-
102
-
103
-
104
-
105
-
 106
106 -
 107
107 -
 108
108 -
 109
109 -
 110
110 -
 111
111 -
 112
112 -
 113
113 -
 114
114 -
 115
115 -
 116
116 -
 117
117 -
 118
118 -
 119
119 -
 120
120 -
 121
121 -
 122
122 -
 123
123 -
 124
124 -
 125
125 -
 126
126
 |
 |

F-60
Fiscal Year
Affiliation with
Re
g
istrant
Deferred
Policy
Acquisition
Cost
Reserves for
Unpaid Claims
and Adjustment
Expenses
Discount if
any,
Deducted
Unearned
Premiums
Net Earned
Premiums
(
1
)
Net
Investment
Income
(
2
)
Claim and Claim
Adjustment
Expenses
Incurred Related
to Current Yea
r
Claim and Claim
Adjustment
Expenses
Incurred Related
to Prior Yea
r
Amortization of
Deferred Policy
Acquisition
Costs
Paid Claims
and Claim
Adjustment
Expense
Net
Premiums
Written
(
1
)
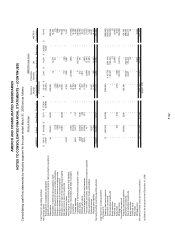
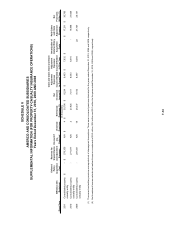
2011 Consolidated property
casualty entity
-$ 276,355$ N/A 4$ 30,704$ 8,234$ 9,453$ 7,832$ -$ 17,211$ 30,706$
2010 Consolidated property
casualty entity
- 271,677 N/A 2 27,625 7,411 8,043 6,516 - 19,996 27,608
2009 Consolidated property
casualty entity
- 287,501 N/A 19 28,337 9,192 8,497 9,384 22 27,707 28,157
(In thousands)
(1) The earned and written premiums are reported net of intersegment transactions. There were no earned premiums eliminated for the years ended December 31, 2010, 2009 and 2008, respectively.
(2) Net Investment Income excludes net realized losses on investments of $0.3 million, $0.6 million and $0.1 million for the years ended December 31, 2010, 2009 and 2008, respectively.
AMERCO AND CONSOLIDATED SUBSIDIARIES
SUPPLEMENTAL INFORMATION (FOR PROPERTY-CASUALTY INSURANCE OPERATIONS)
Years Ended December 31, 2010, 2009 AND 2008
SCHEDULE V