U-Haul 2011 Annual Report Download - page 86
Download and view the complete annual report
Please find page 86 of the 2011 U-Haul annual report below. You can navigate through the pages in the report by either clicking on the pages listed below, or by using the keyword search tool below to find specific information within the annual report.-
 1
1 -
2
-
3
-
4
-
5
-
6
-
7
-
8
-
9
-
10
-
11
-
12
-
13
-
14
-
15
-
16
-
17
-
18
-
19
-
20
-
21
-
22
-
23
-
24
-
25
-
26
-
27
-
28
-
29
-
30
-
31
-
32
-
33
-
34
-
35
-
36
-
37
-
38
-
39
-
40
-
41
-
42
-
43
-
44
-
45
-
46
-
47
-
48
-
49
-
50
-
51
-
52
-
53
-
54
-
55
-
56
-
57
-
58
-
59
-
60
-
61
-
62
-
63
-
64
-
65
-
66
-
67
-
68
-
69
-
70
-
71
-
72
-
73
-
74
-
75
-
 76
76 -
 77
77 -
 78
78 -
 79
79 -
 80
80 -
 81
81 -
 82
82 -
 83
83 -
 84
84 -
 85
85 -
 86
86 -
 87
87 -
 88
88 -
 89
89 -
 90
90 -
 91
91 -
 92
92 -
 93
93 -
 94
94 -
 95
95 -
 96
96 -
97
-
98
-
99
-
100
-
101
-
102
-
103
-
104
-
105
-
106
-
107
-
108
-
109
-
110
-
111
-
112
-
113
-
114
-
115
-
116
-
117
-
118
-
119
-
120
-
121
-
122
-
123
-
124
-
125
-
126
 |
 |

AMERCO AND CONSOLIDATED SUBSIDIARIES
NOTES TO CONSOLIDATED FINANCIAL STATEMENTS -- (CONTINUED)
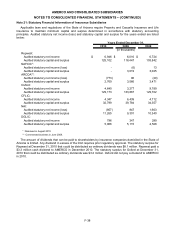
A financial instrument’s level within the fair value hierarchy is based on the lowest level of any input that is
significant to the fair value measurement. The following table represents the financial assets and liabilities on
the condensed consolidated balance sheet at March 31, 2011, that are subject to ASC 820 and the valuation
approach applied to each of these items.
Total
Quoted Prices in Active
Markets for Identical
Assets (Level 1)
Significant
Other
Observable
Inputs (Level 2)
Significant
Unobservable
Inputs (Level 3)
Assets
Short-term investments $ 379,521 $ 379,521 $ - $ -
Fixed maturities - available for sale 609,767 484,921 123,469 1,377
Preferred stock 32,081 32,081 - -
Common stock 25,958 25,958 - -
Less: Preferred stock of AMERCO held by
subsidiaries (7,997) (7,997) - -
Total $ 1,039,330 $ 914,484 $ 123,469 $ 1,377
Liabilities
Guaranteed residual values of TRAC leases $- $ - $ - $ -
Derivatives 51,052 - 51,052 -
Other obligations 174 - - 174
Total $ 51,226 $ - $ 51,052 $ 174
(In thousands)
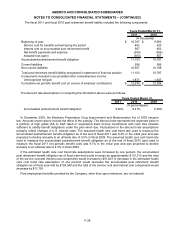
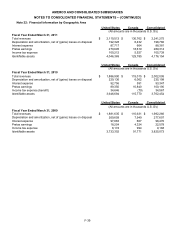
The following tables represent the fair value measurements for our assets and liabilities at March 31, 2011
using significant unobservable inputs (Level 3).
A
uction Rate
Securities
Asset
Backed
Securities Total
Balance at March 31, 2010 $ 1,673 $ 1,615 $ 3,288
Transfers into Level 3 (a) 43 - 43
Fixed Maturities - Auction Rate Securities gain (unrealized) 2 - 2
Fixed Maturities - Auction Rate Securities loss (unrealized) (24) - (24)
Fixed Maturities - Asset Backed Securities gain (unrealized) - 315 315
Fixed Maturities - Asset Backed Securities loss (unrealized) - (202) (202)
Securities called at par (1,694) (95) (1,789)
Securities OTTI loss (realized) - (256) (256)
Balance at March 31, 2011 $ - $ 1,377 $ 1,377
Fixed Maturities
(In thousands)
(a) Reflects the transfer of asset backed securities for which no meaningful market rate bids are currently available. The valuation of
these assets was based on a pricing matrix system as determined by the custodian of these securities.
F-30