U-Haul 2011 Annual Report Download - page 108
Download and view the complete annual report
Please find page 108 of the 2011 U-Haul annual report below. You can navigate through the pages in the report by either clicking on the pages listed below, or by using the keyword search tool below to find specific information within the annual report.-
 1
1 -
2
-
3
-
4
-
5
-
6
-
7
-
8
-
9
-
10
-
11
-
12
-
13
-
14
-
15
-
16
-
17
-
18
-
19
-
20
-
21
-
22
-
23
-
24
-
25
-
26
-
27
-
28
-
29
-
30
-
31
-
32
-
33
-
34
-
35
-
36
-
37
-
38
-
39
-
40
-
41
-
42
-
43
-
44
-
45
-
46
-
47
-
48
-
49
-
50
-
51
-
52
-
53
-
54
-
55
-
56
-
57
-
58
-
59
-
60
-
61
-
62
-
63
-
64
-
65
-
66
-
67
-
68
-
69
-
70
-
71
-
72
-
73
-
74
-
75
-
76
-
77
-
78
-
79
-
80
-
81
-
82
-
83
-
84
-
85
-
86
-
87
-
88
-
89
-
90
-
91
-
92
-
93
-
94
-
95
-
96
-
97
-
 98
98 -
 99
99 -
 100
100 -
 101
101 -
 102
102 -
 103
103 -
 104
104 -
 105
105 -
 106
106 -
 107
107 -
 108
108 -
 109
109 -
 110
110 -
 111
111 -
 112
112 -
 113
113 -
 114
114 -
 115
115 -
 116
116 -
 117
117 -
 118
118 -
119
-
120
-
121
-
122
-
123
-
124
-
125
-
126
 |
 |

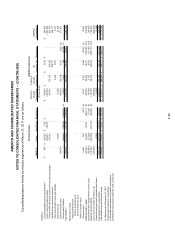
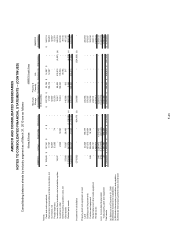
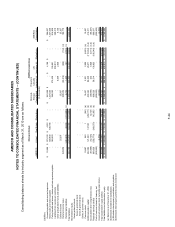
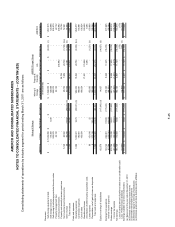
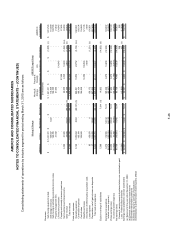
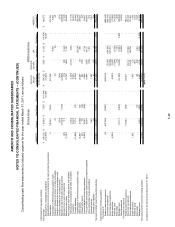
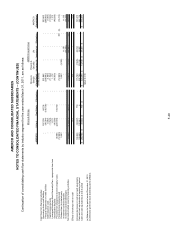
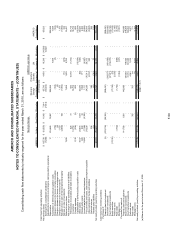
AMERCO AND CONSOLIDATED SUBSIDIARIES
NOTES TO CONSOLIDATED FINANCIAL STATEMENTS -- (CONTINUED)
F-52
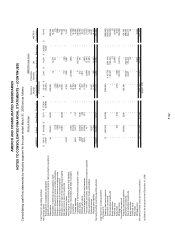
Consolidating cash flow statements by industry segment for the year ended March 31, 2009 are as follows:
AMERCO U-Haul Real Estate Elimination
Moving &
Storage
Consolidated
Property &
Casualty
Insurance (a)
Life
Insurance (a) Elimination
AMERCO
Consolidated
Cash flows from operating activities:
Net earnings (loss) 13,410$ (64,180)$ 6,371$ 57,809$ 13,410$ 5,011$ 11,241$ (16,252)$ 13,410$
Earnings from consolidated subsidiaries 41,557 - - (57,809) (16,252) - - 16,252 -
Adjustments to reconcile net earnings to cash provided by operations:
Depreciation 18 235,916 12,635 - 248,569 - - - 248,569
Amortization of deferred policy acquisition costs - - - - - 22 12,372 - 12,394
Change in allowance for losses on trade receivables - (118) - - (118) - 101 - (17)
Change in allowance for losses on mortgage notes - (309) - - (309) - - - (309)
Change in allowance for inventory reserves - 792 - - 792 - - - 792
Net (gain) loss on sale of real and personal propert
y
- 19,044 (2,400) - 16,644 - - - 16,644
Net (gain) loss on sale of investments - - - - - 110 (46) - 64
Deferred income taxes 4,353 - - - 4,353 1,992 1,596 - 7,941
Net change in other operating assets and liabilities:
Reinsurance recoverables and trade receivables - 2,383 4 - 2,387 (12,958) (498) - (11,069)
Inventories - (6,192) - - (6,192) - - - (6,192)
Prepaid expenses 3,681 (1,417) 164 - 2,428 - - - 2,428
Capitalization of deferred policy acquisition costs - - - - - 8 (10,914) - (10,906)
Other assets (302) (6,607) 1,630 - (5,279) 312 170 - (4,797)
Related party assets 3,857 (3,071) (23) - 763 3,814 - - 4,577
Accounts payable and accrued expenses 2,521 (4,256) 416 - (1,319) - (502) - (1,821)
Policy benefits and losses, claims and loss expenses payable - 417 - - 417 (2,869) (5,168) - (7,620)
Other policyholders' funds and liabilities - - - - - 2,922 (1,429) - 1,493
Deferred income - 13,037 - - 13,037 - - - 13,037
Related party liabilities - (1,390) - - (1,390) 385 (3,187) - (4,192)
Net cash provided (used) by operating activities 69,095 184,049 18,797 - 271,941 (1,251) 3,736 - 274,426
Cash flows from investing activities:
Purchases of:
Property, plant and equipment (1) (342,180) (54,509) - (396,690) - - - (396,690)
Short term investments - - - - - (116,778) (204,144) - (320,922)
Fixed maturities investments - - - - - (15,321) (128,344) - (143,665)
Equity securities - - - - - - (1) - (1)
Preferred stock - - - - - - (2,000) - (2,000)
Real estate - (36) (182) - (218) (396) - - (614)
Mortgage loans - - - - - (12,187) (12,512) - (24,699)
Proceeds from sales of:
Property, plant and equipment - 124,892 3,296 - 128,188 - - - 128,188
Short term investments - - - - - 96,420 202,562 - 298,982
Fixed maturities investments - - - - - 63,871 170,446 - 234,317
Equity securities - - - - - - 28 - 28
Preferred stock - - - - - - - - -
Real estate - - - - - - - - -
Mortgage loans - - - - - 1 5,883 - 5,884
Net cash provided (used) by investing activities (1) (217,324) (51,395) - (268,720) 15,610 31,918 - (221,192)
(a) Balance for the period ended December 31, 2008
Moving & Storage
(In thousands)
(page 1 of 2)
AMERCO Legal Group