U-Haul 2011 Annual Report Download - page 38
Download and view the complete annual report
Please find page 38 of the 2011 U-Haul annual report below. You can navigate through the pages in the report by either clicking on the pages listed below, or by using the keyword search tool below to find specific information within the annual report.-
 1
1 -
2
-
3
-
4
-
5
-
6
-
7
-
8
-
9
-
10
-
11
-
12
-
13
-
14
-
15
-
16
-
17
-
18
-
19
-
20
-
21
-
22
-
23
-
24
-
25
-
26
-
27
-
 28
28 -
 29
29 -
 30
30 -
 31
31 -
 32
32 -
 33
33 -
 34
34 -
 35
35 -
 36
36 -
 37
37 -
 38
38 -
 39
39 -
 40
40 -
 41
41 -
 42
42 -
 43
43 -
 44
44 -
 45
45 -
 46
46 -
 47
47 -
 48
48 -
49
-
50
-
51
-
52
-
53
-
54
-
55
-
56
-
57
-
58
-
59
-
60
-
61
-
62
-
63
-
64
-
65
-
66
-
67
-
68
-
69
-
70
-
71
-
72
-
73
-
74
-
75
-
76
-
77
-
78
-
79
-
80
-
81
-
82
-
83
-
84
-
85
-
86
-
87
-
88
-
89
-
90
-
91
-
92
-
93
-
94
-
95
-
96
-
97
-
98
-
99
-
100
-
101
-
102
-
103
-
104
-
105
-
106
-
107
-
108
-
109
-
110
-
111
-
112
-
113
-
114
-
115
-
116
-
117
-
118
-
119
-
120
-
121
-
122
-
123
-
124
-
125
-
126
 |
 |
33
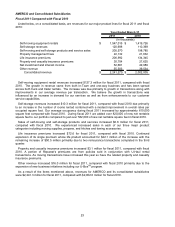
income of $2.4 million. Property and Casualty Insurance does not use debt or equity issues to increase
capital and therefore has no direct exposure to capital market conditions other than through its investment
portfolio.
Life Insurance
The Life Insurance operating segment manages its financial assets to meet policyholder and other
obligations including investment contract withdrawals. Life Insurance’s net withdrawals for the year ended
December 31, 2010 were $22.1 million. State insurance regulations restrict the amount of dividends that
can be paid to stockholders of insurance companies. As a result, Life Insurance’s funds are generally not
available to satisfy the claims of AMERCO or its legal subsidiaries.
Life Insurance’s stockholder’s equity was $188.7 million, $173.2 million, and $156.7 million at
December 31, 2010, 2009 and 2008, respectively. The increase in 2010 compared with 2009 resulted
from earnings of $11.1 million and an increase in other comprehensive income of $4.4 million. Life
Insurance does not use debt or equity issues to increase capital and therefore has no direct exposure to
capital market conditions other than through its investment portfolio.
Cash Provided (Used) from Operating Activities by Operating Segments
Moving and Storage
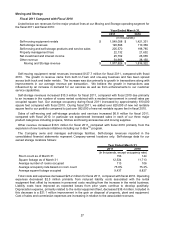
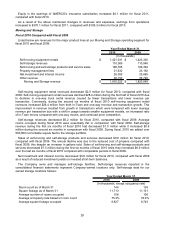
Net cash provided by operating activities was $472.9 million, $366.2 million and $272.5 million in fiscal
2011, 2010 and 2009, respectively. The increase in self-moving equipment rental revenues, storage
revenues and product and service sales was primarily responsible for the improved operating cash flows.
Also, in the third quarter of fiscal 2011 the Company received a $37.4 million refund related to the federal
income tax loss carrybacks filed in fiscal 2010.
Property and Casualty Insurance
Net cash provided (used) by operating activities was $4.3 million, $3.6 million, and ($1.3) million for the
years ended December 31, 2010, 2009, and 2008, respectively. The increase was primarily due to the
increase in premiums related to the “Safe” programs.
Property and Casualty Insurance’s cash and cash equivalents and short-term investment portfolios
amounted to $76.2 million, $106.3 million, and $112.0 million at December 31, 2010, 2009, and 2008,
respectively. This balance reflects funds in transition from maturity proceeds to long term investments.
Management believes this level of liquid assets, combined with budgeted cash flow, is adequate to meet
foreseeable cash needs. Capital and operating budgets allow Property and Casualty Insurance to
schedule cash needs in accordance with investment and underwriting proceeds.
Life Insurance
Net cash provided by operating activities was $97.2 million, $30.1 million and $3.7 million for the years
ended December 31, 2010, 2009 and 2008, respectively. The increase was primarily due to net cash
received with the assumption of the Medicare block of business of $14.9 million, net cash received from a
reinsurance agreement to coinsure a block of Final Expense Life insurance policies of $24.6 million, plus
increases in new sales of our single premium whole life and final expense life insurance products.
In addition to cash flows from operating activities and financing activities, a substantial amount of liquid
funds are available through Life Insurance’s short-term portfolio. At December 31, 2010, 2009 and 2008,
cash and cash equivalents and short-term investments amounted to $53.6 million, $57.5 million and
$39.3 million, respectively. Management believes that the overall sources of liquidity is adequate to meet
foreseeable cash needs.
Liquidity and Capital Resources - Summary
We believe we have the financial resources needed to meet our business plans including our working
capital needs and the redemption of our Series A Preferred Stock which occured on June 1, 2011. The
redemption was funded with existing cash on hand. The Company continues to hold significant cash and
has access to existing credit facilities and additional liquidity to meet our anticipated capital expenditure
requirements for investment in our rental fleet, rental equipment and storage acquisitions and build outs.