U-Haul 2011 Annual Report Download - page 33
Download and view the complete annual report
Please find page 33 of the 2011 U-Haul annual report below. You can navigate through the pages in the report by either clicking on the pages listed below, or by using the keyword search tool below to find specific information within the annual report.-
 1
1 -
2
-
3
-
4
-
5
-
6
-
7
-
8
-
9
-
10
-
11
-
12
-
13
-
14
-
15
-
16
-
17
-
18
-
19
-
20
-
21
-
22
-
 23
23 -
 24
24 -
 25
25 -
 26
26 -
 27
27 -
 28
28 -
 29
29 -
 30
30 -
 31
31 -
 32
32 -
 33
33 -
 34
34 -
 35
35 -
 36
36 -
 37
37 -
 38
38 -
 39
39 -
 40
40 -
 41
41 -
 42
42 -
 43
43 -
44
-
45
-
46
-
47
-
48
-
49
-
50
-
51
-
52
-
53
-
54
-
55
-
56
-
57
-
58
-
59
-
60
-
61
-
62
-
63
-
64
-
65
-
66
-
67
-
68
-
69
-
70
-
71
-
72
-
73
-
74
-
75
-
76
-
77
-
78
-
79
-
80
-
81
-
82
-
83
-
84
-
85
-
86
-
87
-
88
-
89
-
90
-
91
-
92
-
93
-
94
-
95
-
96
-
97
-
98
-
99
-
100
-
101
-
102
-
103
-
104
-
105
-
106
-
107
-
108
-
109
-
110
-
111
-
112
-
113
-
114
-
115
-
116
-
117
-
118
-
119
-
120
-
121
-
122
-
123
-
124
-
125
-
126
 |
 |

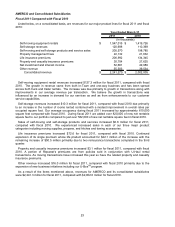
Equity in the earnings of AMERCO’s insurance subsidiaries increased $0.1 million for fiscal 2011,
compared with fiscal 2010.
As a result of the above mentioned changes in revenues and expenses, earnings from operations
increased to $370.1 million for fiscal 2011, compared with $185.3 million for fiscal 2010.
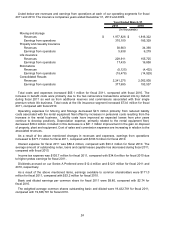
Moving and Storage
Fiscal 2010 Compared with Fiscal 2009
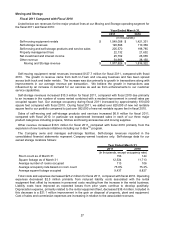
Listed below are revenues for the major product lines at our Moving and Storage operating segment for
fiscal 2010 and fiscal 2009:
2010 2009
Self-moving equipment rentals $ 1,421,331 $ 1,423,330
Self-storage revenues 110,369 110,548
Self-moving and self-storage products and service sales 198,785 199,394
Property management fees 21,632 23,192
Net investment and interest income 26,055 29,865
Other revenue 38,150 36,720
Moving and Storage revenue $ 1,816,322 $ 1,823,049
Year Ended March 31,
(In thousands)
Self-moving equipment rental revenues decreased $2.0 million for fiscal 2010, compared with fiscal
2009. Self-moving equipment rental revenues declined $28.4 million during the first half of fiscal 2010 due
to declines in one-way truck rental revenue caused by fewer transactions and lower revenue per
transaction. Conversely, during the second six months of fiscal 2010 self-moving equipment rental
revenues increased $26.4 million from both In-Town and one-way revenue and transaction growth. This
improvement in revenue resulted from growth in transactions which were tempered with lower average
revenue per transaction due with a shift in usage towards smaller equipment models, an increased ratio
of In-Town moves compared with one-way moves, and continued price competition.
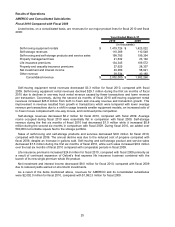
Self-storage revenues decreased $0.2 million for fiscal 2010, compared with fiscal 2009. Average
rooms occupied during fiscal 2010 were essentially flat in comparison with fiscal 2009. Self-storage
revenue during the first six months of fiscal 2010 had decreased $1.0 million while it increased $0.8
million during the second six months in comparison with fiscal 2009. During fiscal, 2010 we added over
580,000 net rentable square feet to the storage portfolio.
Sales of self-moving and self-storage products and services decreased $0.6 million for fiscal 2010,
compared with fiscal 2009. The annual decline was due to the reduced cost of propane compared with
fiscal 2009, this despite an increase in gallons sold. Sales of self-moving and self-storage products and
services decreased $7.5 million during the first six months of fiscal 2010 while they increased $6.9 million
over the last six months of fiscal 2010 compared with comparable periods in fiscal 2009.
Net investment and interest income decreased $3.8 million for fiscal 2010, compared with fiscal 2009
as a result of reduced investment yields on invested short-term balances.
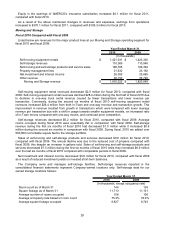
The Company owns and manages self-storage facilities. Self-storage revenues reported in the
consolidated financial statements represent Company-owned locations only. Self-storage data for our
owned storage locations follows:
2010 2009
Room count as of March 31 144 138
Square footage as of March 31 11,713 11,131
Average number of rooms occupied 106 106
Average occupancy rate based on room count 75.2% 78.9%
Average square footage occupied 8,827 8,745
Year Ended March 31,
(In thousands, except occupancy rate)
28