U-Haul 2011 Annual Report Download - page 21
Download and view the complete annual report
Please find page 21 of the 2011 U-Haul annual report below. You can navigate through the pages in the report by either clicking on the pages listed below, or by using the keyword search tool below to find specific information within the annual report.-
 1
1 -
2
-
3
-
4
-
5
-
6
-
7
-
8
-
9
-
10
-
 11
11 -
 12
12 -
 13
13 -
 14
14 -
 15
15 -
 16
16 -
 17
17 -
 18
18 -
 19
19 -
 20
20 -
 21
21 -
 22
22 -
 23
23 -
 24
24 -
 25
25 -
 26
26 -
 27
27 -
 28
28 -
 29
29 -
 30
30 -
 31
31 -
32
-
33
-
34
-
35
-
36
-
37
-
38
-
39
-
40
-
41
-
42
-
43
-
44
-
45
-
46
-
47
-
48
-
49
-
50
-
51
-
52
-
53
-
54
-
55
-
56
-
57
-
58
-
59
-
60
-
61
-
62
-
63
-
64
-
65
-
66
-
67
-
68
-
69
-
70
-
71
-
72
-
73
-
74
-
75
-
76
-
77
-
78
-
79
-
80
-
81
-
82
-
83
-
84
-
85
-
86
-
87
-
88
-
89
-
90
-
91
-
92
-
93
-
94
-
95
-
96
-
97
-
98
-
99
-
100
-
101
-
102
-
103
-
104
-
105
-
106
-
107
-
108
-
109
-
110
-
111
-
112
-
113
-
114
-
115
-
116
-
117
-
118
-
119
-
120
-
121
-
122
-
123
-
124
-
125
-
126
 |
 |

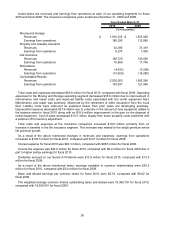
Item 6. Selected Financial Data
The following selected financial data should be read in conjunction with the MD&A, and the
Consolidated Financial Statements and related notes in this Annual Report on Form 10-K.
Listed below is selected financial data for AMERCO and consolidated entities for each of the last five
years ended March 31:
2011 2010 2009 2008 (b), (c) 2007
Summary of Operations:
Self-moving equipment rentals $ 1,547,015 $ 1,419,726 $ 1,423,022 $ 1,451,292 $ 1,462,470
Self-storage revenues 120,698 110,369 110,548 122,248 126,424
Self-moving and self-storage products and service sales 205,570 198,785 199,394 217,798 224,722
Property management fees 22,132 21,632 23,192 22,820 21,154
Life insurance premiums 206,992 134,345 109,572 111,996 120,399
Property and casualty insurance premiums 30,704 27,625 28,337 28,388 24,335
Net investment and interest income 52,661 49,989 58,021 62,110 59,696
Other revenue 55,503 39,534 40,180 32,522 30,098
Total revenues 2,241,275 2,002,005 1,992,266 2,049,174 2,069,298
Operating expenses 1,026,577 1,022,061 1,057,880 1,089,543 1,091,792
Commission expenses 190,981 169,104 171,303 167,945 162,899
Cost of sales 106,024 104,049 114,387 120,210 117,648
Benefits and losses 190,429 121,105 97,617 98,760 107,345
Amortization of deferred policy acquisition costs 9,494 7,569 12,394 13,181 17,138
Lease expense 150,809 156,951 152,424 133,931 147,659
Depreciation, net of (gains) losses on disposals (e) 189,266 227,629 265,213 221,882 189,589
Total costs and expenses 1,863,580 1,808,468 1,871,218 1,845,452 1,834,070
Earnings from operations 377,695 193,537 121,048 203,722 235,228
Interest expense (88,381) (93,347) (98,470) (101,420) (82,436)
Fees and amortization on early extinguishment of debt (a) - - - - (6,969)
Pretax earnings 289,314 100,190 22,578 102,302 145,823
Income tax expense (105,739) (34,567) (9,168) (34,518) (55,270)
Net earnings 183,575 65,623 13,410 67,784 90,553
Excess (loss) carrying amount of preferred stock over consideration paid (178) 388 - - -
Less: Preferred stock dividends (d) (12,412) (12,856) (12,963) (12,963) (12,963)
Earnings available to common shareholders $ 170,985 $ 53,155 $ 447 $ 54,821 $ 77,590
Basic and diluted earnings per common share $ 8.80 $ 2.74 $ 0.02 $ 2.78 $ 3.72
Weighted average common shares outstanding: Basic and diluted 19,432,781 19,386,791 19,350,041 19,740,571 20,838,570
Cash dividends declared and accrued Preferred stock $ 12,963 $ 12,963 $ 12,963 $ 12,963 $ 12,963
Balance Sheet Data:
Property, plant and equipment, net $ 2,094,573 $ 1,948,388 $ 2,013,928 $ 2,011,176 $ 1,897,071
Total assets 4,176,154 3,762,454 3,825,073 3,832,487 3,523,048
Notes, loans and leases payable 1,397,842 1,347,635 1,546,490 1,504,677 1,181,165
SAC Holding II notes and loans payable, non re-course to AMERCO - - - - 74,887
Stockholders' equity 993,020 812,911 717,629 758,431 718,098
(a) Includes the write-off of debt issuance costs of $7.0 million in fiscal 2007.
(b) Fiscal 2008 summary of operations includes 7 months of activity for SAC Holding II which was deconsolidated effective October 31, 2007.
(c) Fiscal 2008 balance sheet data does not include SAC Holding II which was deconsolidated effective October 31, 2007.
(d) Fiscal 2011 and 2010 reflect eliminations of $0.6 million and $0.1 million, respectivley paid to affiliates.
Years Ended March 31,
(In thousands, except share and per share data)
(e) (Gains) losses were ($23.1) million, ($2.0) million, $16.6 million, ($5.9) million and $3.4 million for fiscal 2011, 2010, 2009, 2008 and 2007, respectively.
16