U-Haul 2011 Annual Report Download - page 113
Download and view the complete annual report
Please find page 113 of the 2011 U-Haul annual report below. You can navigate through the pages in the report by either clicking on the pages listed below, or by using the keyword search tool below to find specific information within the annual report.-
 1
1 -
2
-
3
-
4
-
5
-
6
-
7
-
8
-
9
-
10
-
11
-
12
-
13
-
14
-
15
-
16
-
17
-
18
-
19
-
20
-
21
-
22
-
23
-
24
-
25
-
26
-
27
-
28
-
29
-
30
-
31
-
32
-
33
-
34
-
35
-
36
-
37
-
38
-
39
-
40
-
41
-
42
-
43
-
44
-
45
-
46
-
47
-
48
-
49
-
50
-
51
-
52
-
53
-
54
-
55
-
56
-
57
-
58
-
59
-
60
-
61
-
62
-
63
-
64
-
65
-
66
-
67
-
68
-
69
-
70
-
71
-
72
-
73
-
74
-
75
-
76
-
77
-
78
-
79
-
80
-
81
-
82
-
83
-
84
-
85
-
86
-
87
-
88
-
89
-
90
-
91
-
92
-
93
-
94
-
95
-
96
-
97
-
98
-
99
-
100
-
101
-
102
-
 103
103 -
 104
104 -
 105
105 -
 106
106 -
 107
107 -
 108
108 -
 109
109 -
 110
110 -
 111
111 -
 112
112 -
 113
113 -
 114
114 -
 115
115 -
 116
116 -
 117
117 -
 118
118 -
 119
119 -
 120
120 -
 121
121 -
 122
122 -
 123
123 -
124
-
125
-
126
 |
 |

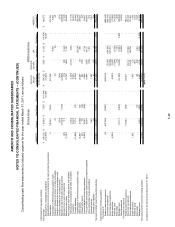
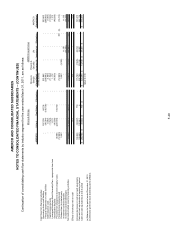
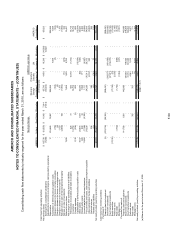
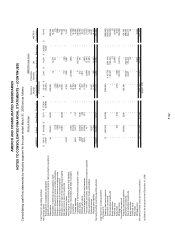
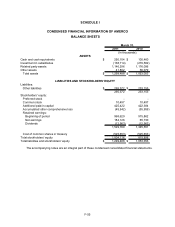
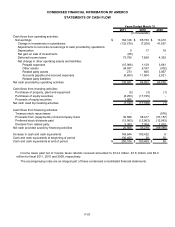
CONDENSED FINANCIAL INFORMATION OF AMERCO
STATEMENTS OF CASH FLOW
2011 2010 2009
Cash flows from operating activities:
Net earnings $ 184,126 $ 65,730 $ 13,410
Change in investments in subsidiaries (132,570) (7,208) 41,557
Adjustments to reconcile net earnings to cash provided by operations:
Depreciation 9 17 18
Net gain on sale of investments (65) - -
Deferred income taxes 73,790 7,828 4,353
Net change in other operating assets and liabilities:
Prepaid expenses (15,966) 1,129 3,681
Other assets 34,937 5,187 (302)
Related party assets 273 665 3,857
Accounts payable and accrued expenses (8,603) 11,604 2,521
Related party liabilities - - -
Net cash provided by operating activities 135,931 84,952 69,095
Cash flows from investing activities:
Purchases of property, plant and equipment (5) (3) (1)
Purchases of equity securities (8,253) (17,745) -
Proceeds of equity securities 1,065 - -
Net cash used by investing activities (7,193) (17,748) (1)
Cash flows from financing activities:
Treasury stock repurchases - - (976)
Proceeds from (repayments) of intercompany loans 30,566 38,417 (57,157)
Preferred stock dividends paid (12,963) (12,963) (12,963)
Dividend from related party 3,303 7,764 2,010
Net cash provided (used) by financing activities 20,906 33,218 (69,086)
Increase in cash and cash equivalents 149,644 100,422 8
Cash and cash equivalents at beginning of period 100,460 38 30
Cash and cash equivalents at end of period $ 250,104 $ 100,460 $ 38
Years Ended March 31,
(In thousands)
Income taxes paid net of income taxes refunds received amounted to $14.3 million, $1.6 million and $2.0
million for fiscal 2011, 2010 and 2009, respectively.
The accompanying notes are an integral part of these condensed consolidated financial statements.
F-57