U-Haul 2011 Annual Report Download - page 40
Download and view the complete annual report
Please find page 40 of the 2011 U-Haul annual report below. You can navigate through the pages in the report by either clicking on the pages listed below, or by using the keyword search tool below to find specific information within the annual report.-
 1
1 -
2
-
3
-
4
-
5
-
6
-
7
-
8
-
9
-
10
-
11
-
12
-
13
-
14
-
15
-
16
-
17
-
18
-
19
-
20
-
21
-
22
-
23
-
24
-
25
-
26
-
27
-
28
-
29
-
 30
30 -
 31
31 -
 32
32 -
 33
33 -
 34
34 -
 35
35 -
 36
36 -
 37
37 -
 38
38 -
 39
39 -
 40
40 -
 41
41 -
 42
42 -
 43
43 -
 44
44 -
 45
45 -
 46
46 -
 47
47 -
 48
48 -
 49
49 -
 50
50 -
51
-
52
-
53
-
54
-
55
-
56
-
57
-
58
-
59
-
60
-
61
-
62
-
63
-
64
-
65
-
66
-
67
-
68
-
69
-
70
-
71
-
72
-
73
-
74
-
75
-
76
-
77
-
78
-
79
-
80
-
81
-
82
-
83
-
84
-
85
-
86
-
87
-
88
-
89
-
90
-
91
-
92
-
93
-
94
-
95
-
96
-
97
-
98
-
99
-
100
-
101
-
102
-
103
-
104
-
105
-
106
-
107
-
108
-
109
-
110
-
111
-
112
-
113
-
114
-
115
-
116
-
117
-
118
-
119
-
120
-
121
-
122
-
123
-
124
-
125
-
126
 |
 |
35
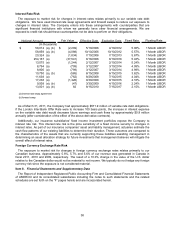
(b) These estimated obligations are based on mortality, morbidity, withdrawal and lapse assumptions drawn from our historical
experience and adjusted for any known trends. These obligations include expected interest crediting but no amounts for future
annuity deposits or premiums for life and Medicare supplement policies. The cash flows shown are undiscounted for interest and as
a result total outflows for all years shown significantly exceed the corresponding liabilities of $500.0 million included in our
consolidated balance sheet as of March 31, 2011. Life Insurance expects to fully fund these obligations from their invested asset
portfolio. Due to the significant assumptions employed in this model, the amounts shown could materially differ from actual results.
(c) These estimated obligations are primarily the Company’s self insurance accruals for portions of the liability coverage for our
rental equipment. The estimates for future settlement are based upon historical experience and current trends. Due to the significant
assumptions employed in this model, the amounts shown could materially differ from actual results.
As presented above, contractual obligations on debt and guarantees represent principal payments
while contractual obligations for operating leases represent the notional payments under the lease
arrangements.
ASC 740 - Income Taxes liabilities and interest of $13.3 million is not included above due to uncertainty
surrounding ultimate settlements, if any.
Off Balance Sheet Arrangements
The Company uses off-balance sheet arrangements in situations where management believes that the
economics and sound business principles warrant their use.
AMERCO utilizes operating leases for certain rental equipment and facilities with terms expiring
substantially through 2017, with the exception of one land lease expiring in 2034. In the event of a
shortfall in proceeds from the sales of the underlying rental equipment assets, AMERCO has guaranteed
approximately $167.6 million of residual values at March 31, 2011 for these assets at the end of their
respective lease terms. AMERCO has been leasing rental equipment since 1987. To date, we have not
experienced residual value shortfalls related to these leasing arrangements. Using the average cost of
fleet related debt as the discount rate, the present value of AMERCO’s minimum lease payments and
residual value guarantees were $455.4 million at March 31, 2011.
Historically, AMERCO has used off-balance sheet arrangements in connection with the expansion of
our self-storage business. For more information please see Note 20, Related Party Transactions of the
Notes to Consolidated Financial Statements. These arrangements were primarily used when the
Company’s overall borrowing structure was more limited. The Company does not face similar limitations
currently and off-balance sheet arrangements have not been utilized in our self-storage expansion in
recent years. In the future, the Company will continue to identify and consider off-balance sheet
opportunities to the extent such arrangements would be economically advantageous to the Company and
its stockholders.
The Company currently manages the self-storage properties owned or leased by SAC Holdings,
Mercury Partners, L.P. (“Mercury”), Four SAC Self-Storage Corporation (“4 SAC”), Five SAC Self-Storage
Corporation (“5 SAC”), Galaxy Investments, L.P. (“Galaxy”) and Private Mini Storage Realty, L.P.
(“Private Mini”) pursuant to a standard form of management agreement, under which the Company
receives a management fee of between 4% and 10% of the gross receipts plus reimbursement for certain
expenses. The Company received management fees, exclusive of reimbursed expenses, of $22.0 million,
$22.6 million and $24.3 million from the above mentioned entities during fiscal 2011, 2010 and 2009,
respectively. This management fee is consistent with the fee received for other properties the Company
previously managed for third parties. SAC Holdings, 4 SAC, 5 SAC, Galaxy and Private Mini are
substantially controlled by Blackwater Investments, Inc. (“Blackwater”). Mercury is substantially controlled
by Mark V. Shoen. James P. Shoen, a significant shareholder and director of AMERCO, has an interest in
Mercury.
The Company leases space for marketing company offices, vehicle repair shops and hitch installation
centers from subsidiaries of SAC Holdings, 5 SAC and Galaxy. Total lease payments pursuant to such
leases were $2.5 million, $2.5 million and $2.4 million in fiscal 2011, 2010 and 2009, respectively. The
terms of the leases are similar to the terms of leases for other properties owned by unrelated parties that
are leased by the Company.