U-Haul 2011 Annual Report Download - page 81
Download and view the complete annual report
Please find page 81 of the 2011 U-Haul annual report below. You can navigate through the pages in the report by either clicking on the pages listed below, or by using the keyword search tool below to find specific information within the annual report.-
 1
1 -
2
-
3
-
4
-
5
-
6
-
7
-
8
-
9
-
10
-
11
-
12
-
13
-
14
-
15
-
16
-
17
-
18
-
19
-
20
-
21
-
22
-
23
-
24
-
25
-
26
-
27
-
28
-
29
-
30
-
31
-
32
-
33
-
34
-
35
-
36
-
37
-
38
-
39
-
40
-
41
-
42
-
43
-
44
-
45
-
46
-
47
-
48
-
49
-
50
-
51
-
52
-
53
-
54
-
55
-
56
-
57
-
58
-
59
-
60
-
61
-
62
-
63
-
64
-
65
-
66
-
67
-
68
-
69
-
70
-
 71
71 -
 72
72 -
 73
73 -
 74
74 -
 75
75 -
 76
76 -
 77
77 -
 78
78 -
 79
79 -
 80
80 -
 81
81 -
 82
82 -
 83
83 -
 84
84 -
 85
85 -
 86
86 -
 87
87 -
 88
88 -
 89
89 -
 90
90 -
 91
91 -
92
-
93
-
94
-
95
-
96
-
97
-
98
-
99
-
100
-
101
-
102
-
103
-
104
-
105
-
106
-
107
-
108
-
109
-
110
-
111
-
112
-
113
-
114
-
115
-
116
-
117
-
118
-
119
-
120
-
121
-
122
-
123
-
124
-
125
-
126
 |
 |

AMERCO AND CONSOLIDATED SUBSIDIARIES
NOTES TO CONSOLIDATED FINANCIAL STATEMENTS -- (CONTINUED)
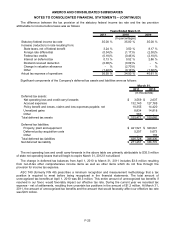
The difference between the tax provision at the statutory federal income tax rate and the tax provision
attributable to income before taxes was as follows:
2011 2010 2009
Statutory federal income tax rate 35.00 % 35.00 % 35.00 %
Increase (reduction) in rate resulting from:
State taxes, net of federal benefit 3.24 % 3.50 % 8.17 %
Foreign rate differential (0.34)% (1.17)% (2.30)%
Federal tax credits (0.18)% (0.46)% (2.10)%
Interest on deferred tax 0.13 % 0.52 % 2.86 %
Dividend received deduction (0.08)% (0.09)% - %
Change in valuation allowance - % (2.70)% - %
Other (1.22)% (0.10)% (1.02)%
Actual tax expense of operations 36.55 % 34.50 % 40.61 %
Years Ended March 31,
(In percentages)
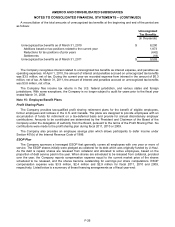
Significant components of the Company’s deferred tax assets and liabilities were as follows:
2011 2010
Deferred tax assets:
Net operating loss and credit carry forwards $3,559 $ 2,637
Accrued expenses 132,140 127,785
Policy benefit and losses, claims and loss expenses payable, net 10,355 14,420
Unrealized gains 8,834 14,818
Other 583 -
Total deferred tax assets $ 155,471 $159,660
Deferred tax liabilities:
Property, plant and equipment $ 421,521 $340,641
Deferred policy acquisition costs 5,207 5,673
Other - 116
Total deferred tax liabilities 426,728 346,430
Net deferred tax liability $ 271,257 $186,770
March 31,
(In thousands)
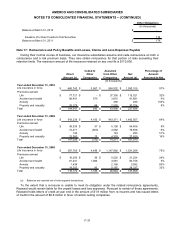
The net operating loss and credit carry-forwards in the above table are primarily attributable to $35.5 million
of state net operating losses that will begin to expire March 31, 2012 if not utilized.
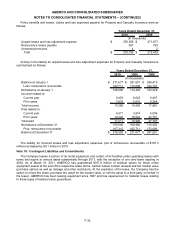
The change in deferred tax balances from April 1, 2010 to March 31, 2011 includes $3.6 million resulting
from net-of-tax other comprehensive income items as well as other items which do not flow through the
provision for income tax expense.
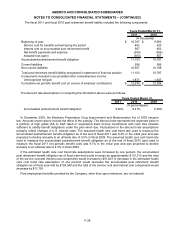
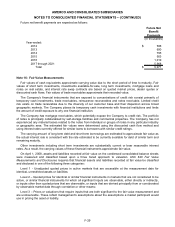
ASC 740 (formerly FIN 48) prescribes a minimum recognition and measurement methodology that a tax
position is required to meet before being recognized in the financial statements. The total amount of
unrecognized tax benefits at April 1, 2010 was $8.3 million. This entire amount of unrecognized tax benefits if
resolved in our favor, would favorably impact our effective tax rate. During the current year we recorded tax
expense - net of settlements, resulting from uncertain tax positions in the amount of $1.2 million. At March 31,
2011, the amount of unrecognized tax benefits and the amount that would favorably affect our effective tax rate
was $9.5 million.
F-25