U-Haul 2011 Annual Report Download - page 58
Download and view the complete annual report
Please find page 58 of the 2011 U-Haul annual report below. You can navigate through the pages in the report by either clicking on the pages listed below, or by using the keyword search tool below to find specific information within the annual report.
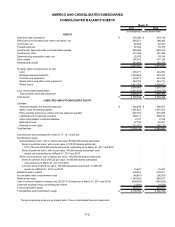
AMERCO AND CONSOLIDATED SUBSIDIARIES
CONSOLIDATED BALANCE SHEETS
2011 2010
ASSETS
Cash and cash equivalents $ 375,496 $ 244,118
Reinsurance recoverables and trade receivables, net 205,371 198,283
Inventories, net 59,942 52,837
Prepaid expenses 57,624 53,379
Investments, fixed maturities and marketable equities 659,809 549,318
Investments, other 201,868 227,486
Deferred policy acquisition costs, net 52,870 39,194
Other assets 166,633 147,325
Related party assets 301,968 302,126
2,081,581 1,814,066
Property, plant and equipment, at cost:
Land 239,177 224,904
Buildings and improvements 1,024,669 970,937
Furniture and equipment 310,671 323,334
Rental trailers and other rental equipment 249,700 244,131
Rental trucks 1,611,763 1,529,817
3,435,980 3,293,123
Less: Accumulated depreciation (1,341,407) (1,344,735)
Total property, plant and equipment 2,094,573 1,948,388
Total assets $ 4,176,154 $ 3,762,454
LIABILITIES AND STOCKHOLDERS' EQUITY
Liabilities:
Accounts payable and accrued expenses $ 304,006 $ 296,057
Notes, loans and leases payable 1,397,842 1,347,635
Policy benefits and losses, claims and loss expenses payable 927,376 816,909
Liabilities from investment contracts 246,717 268,810
Other policyholders' funds and liabilities 8,727 8,155
Deferred income 27,209 25,207
Deferred income taxes 271,257 186,770
Total liabilities 3,183,134 2,949,543
Commitments and contingencies (notes 9, 17, 18, 19 and 20)
Stockholders' equity:
Series preferred stock, with or without par value, 50,000,000 shares authorized:
Series A preferred stock, with no par value, 6,100,000 shares authorized;
5,791,700 and 5,992,800 shares issued and outstanding as of March 31, 2011 and 2010 - -
Series B preferred stock, with no par value, 100,000 shares authorized; none
issued and outstanding as of March 31, 2011 and 2010 - -
Series common stock, with or without par value, 150,000,000 shares authorized:
Series A common stock of $0.25 par value, 10,000,000 shares authorized;
none issued as of March 31, 2011 and 2010 - -
Common stock of $0.25 par value, 150,000,000 shares authorized; 41,985,700
issued as of March 31, 2011 and 2010 10,497 10,497
Additional paid-in capital 418,023 419,811
Accumulated other comprehensive loss (46,467) (56,207)
Retained earnings 1,140,002 969,017
Cost of common shares in treasury, net (22,377,912 shares as of March 31, 2011 and 2010) (525,653) (525,653)
Unearned employee stock ownership plan shares (3,382) (4,554)
Total stockholders' equity 993,020 812,911
Total liabilities and stockholders' equity $ 4,176,154 $ 3,762,454
March 31,
(In thousands, except share data)
The accompanying notes are an integral part of these consolidated financial statements.
F-2


