U-Haul 2011 Annual Report Download - page 42
Download and view the complete annual report
Please find page 42 of the 2011 U-Haul annual report below. You can navigate through the pages in the report by either clicking on the pages listed below, or by using the keyword search tool below to find specific information within the annual report.-
 1
1 -
2
-
3
-
4
-
5
-
6
-
7
-
8
-
9
-
10
-
11
-
12
-
13
-
14
-
15
-
16
-
17
-
18
-
19
-
20
-
21
-
22
-
23
-
24
-
25
-
26
-
27
-
28
-
29
-
30
-
31
-
 32
32 -
 33
33 -
 34
34 -
 35
35 -
 36
36 -
 37
37 -
 38
38 -
 39
39 -
 40
40 -
 41
41 -
 42
42 -
 43
43 -
 44
44 -
 45
45 -
 46
46 -
 47
47 -
 48
48 -
 49
49 -
 50
50 -
 51
51 -
 52
52 -
53
-
54
-
55
-
56
-
57
-
58
-
59
-
60
-
61
-
62
-
63
-
64
-
65
-
66
-
67
-
68
-
69
-
70
-
71
-
72
-
73
-
74
-
75
-
76
-
77
-
78
-
79
-
80
-
81
-
82
-
83
-
84
-
85
-
86
-
87
-
88
-
89
-
90
-
91
-
92
-
93
-
94
-
95
-
96
-
97
-
98
-
99
-
100
-
101
-
102
-
103
-
104
-
105
-
106
-
107
-
108
-
109
-
110
-
111
-
112
-
113
-
114
-
115
-
116
-
117
-
118
-
119
-
120
-
121
-
122
-
123
-
124
-
125
-
126
 |
 |

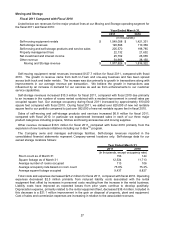
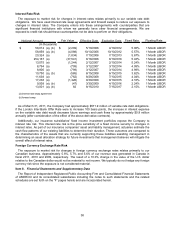
Quarterly Results (unaudited)
The quarterly results shown below are derived from unaudited financial statements for the eight
quarters beginning April 1, 2009 and ending March 31, 2011. The Company believes that all necessary
adjustments have been included in the amounts stated below to present fairly, and in accordance with
GAAP, such results. Moving and Storage operations are seasonal and proportionally more of the
Company’s revenues and net earnings from its Moving and Storage operations are generated in the first
and second quarters of each fiscal year (April through September). The operating results for the periods
presented are not necessarily indicative of results for any future period.
March 31,
2011
December 31,
2010
September 30,
2010
June 30,
2010
Total revenues $ 488,370 $ 529,982 $ 636,976 $ 585,947
Earnings from operations 40,188 51,277 158,121 128,109
Net earnings 13,246 18,608 85,219 66,502
Earnings available to common
shareholders 10,163 15,529 81,978 63,315
Basic and diluted earings
per common share $0.52 $ 0.80 $ 4.22 $ 3.26
Weighted average common shares
outstanding: basic and diluted 19,449,243 19,439,622 19,427,595 19,414,815
Quarter Ended
(In thousands, except for share and per share data)
March 31,
2010
December 31,
2009
September 30,
2009
June 30,
2009
Total revenues $ 443,794 $ 463,628 $ 573,924 $ 520,659
Earnings from operations 9,965 28,558 95,818 59,196
Net earnings (loss) (5,020) 3,520 44,691 22,432
Earnings (loss) available to common
shareholders (8,211) 325 41,527 19,514
Basic and diluted earings (loss)
per common share $ (0.43) $ 0.02 $ 2.14 $ 1.01
Weighted average common shares
outstanding: basic and diluted 19,402,035 19,393,306 19,382,101 19,369,591
Quarter Ended
(In thousands, except for share and per share data)
Item 7A. Quantitative and Qualitative Disclosures about Market Risk
We are exposed to financial market risks, including changes in interest rates and currency exchange
rates. To mitigate these risks, we may utilize derivative financial instruments, among other strategies. We
do not use derivative financial instruments for speculative purposes.
37