U-Haul 2011 Annual Report Download - page 71
Download and view the complete annual report
Please find page 71 of the 2011 U-Haul annual report below. You can navigate through the pages in the report by either clicking on the pages listed below, or by using the keyword search tool below to find specific information within the annual report.-
 1
1 -
2
-
3
-
4
-
5
-
6
-
7
-
8
-
9
-
10
-
11
-
12
-
13
-
14
-
15
-
16
-
17
-
18
-
19
-
20
-
21
-
22
-
23
-
24
-
25
-
26
-
27
-
28
-
29
-
30
-
31
-
32
-
33
-
34
-
35
-
36
-
37
-
38
-
39
-
40
-
41
-
42
-
43
-
44
-
45
-
46
-
47
-
48
-
49
-
50
-
51
-
52
-
53
-
54
-
55
-
56
-
57
-
58
-
59
-
60
-
 61
61 -
 62
62 -
 63
63 -
 64
64 -
 65
65 -
 66
66 -
 67
67 -
 68
68 -
 69
69 -
 70
70 -
 71
71 -
 72
72 -
 73
73 -
 74
74 -
 75
75 -
 76
76 -
 77
77 -
 78
78 -
 79
79 -
 80
80 -
 81
81 -
82
-
83
-
84
-
85
-
86
-
87
-
88
-
89
-
90
-
91
-
92
-
93
-
94
-
95
-
96
-
97
-
98
-
99
-
100
-
101
-
102
-
103
-
104
-
105
-
106
-
107
-
108
-
109
-
110
-
111
-
112
-
113
-
114
-
115
-
116
-
117
-
118
-
119
-
120
-
121
-
122
-
123
-
124
-
125
-
126
 |
 |

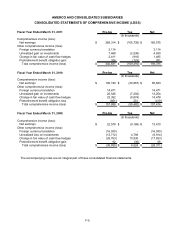
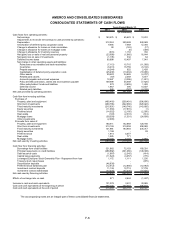
AMERCO AND CONSOLIDATED SUBSIDIARIES
NOTES TO CONSOLIDATED FINANCIAL STATEMENTS -- (CONTINUED)
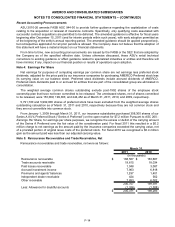
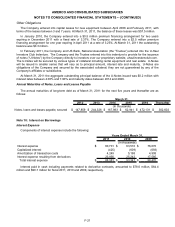
Note 6: Investments
Expected maturities may differ from contractual maturities as borrowers may have the right to call or prepay
obligations with or without call or prepayment penalties.
The Company deposits bonds with insurance regulatory authorities to meet statutory requirements. The
adjusted cost of bonds on deposit with insurance regulatory authorities was $13.9 million and $15.1 million at
March 31, 2011 and 2010, respectively.
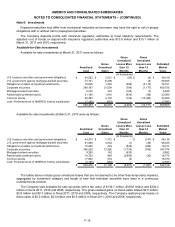
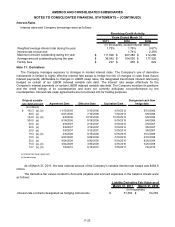
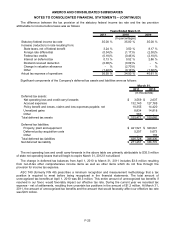
Available-for-Sale Investments
Available-for-sale investments at March 31, 2011 were as follows:
Amortized
Cost
Gross
Unrealized
Gains
Gross
Unrealized
Losses More
than 12
Months
Gross
Unrealized
Losses Less
than 12
Months
Estimated
Market
Value
U.S. treasury securities and government obligations $ 34,522 $ 2,021 $ (20) $ (4) $ 36,519
U.S. government agency mortgage-backed securities 74,721 6,208 - (4) 80,925
Obligations of states and political subdivisions 79,020 1,203 (389) (3,113) 76,721
Corporate securities 389,167 21,559 (794) (1,177) 408,755
Mortgage-backed securities 6,740 223 (108) (7) 6,848
Redeemable preferred stocks 31,190 1,910 (934) (86) 32,080
Common stocks 28,293 8,153 (108) (10,380) 25,958
Less: Preferred stock of AMERCO held by subsidiaries (7,190) (807) - - (7,997)
$ 636,463 $ 40,470 $ (2,353) $ (14,771) $ 659,809
(In thousands)
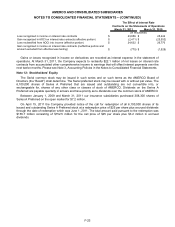
Available-for-sale investments at March 31, 2010 were as follows:
Amortized
Cost
Gross
Unrealized
Gains
Gross
Unrealized
Losses More
than 12
Months
Gross
Unrealized
Losses Less
than 12
Months
Estimated
Market
Value
U.S. treasury securities and government obligations $ 44,573 $ 1,712 $ - $ (147) $ 46,138
U.S. government agency mortgage-backed securities 91,858 4,534 (1) (36) 96,355
Obligations of states and political subdivisions 18,932 323 (846) (398) 18,011
Corporate securities 336,525 13,362 (1,733) (780) 347,374
Mortgage-backed securities 9,250 142 (530) - 8,862
Redeemable preferred stocks 18,723 965 (2,893) (20) 16,775
Common stocks 17,840 534 (4) - 18,370
Less: Preferred stock of AMERCO held by subsidiaries (2,185) (382) - - (2,567)
$ 535,516 $ 21,190 $ (6,007) $ (1,381) $ 549,318
(In thousands)
The tables above include gross unrealized losses that are not deemed to be other-than-temporarily impaired,
aggregated by investment category and length of time that individual securities have been in a continuous
unrealized loss position.
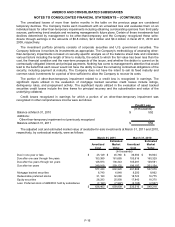
The Company sold available-for-sale securities with a fair value of $134.7 million, $168.6 million and $234.2
million in fiscal 2011, 2010 and 2009, respectively. The gross realized gains on these sales totaled $2.0 million,
$2.8 million and $0.7 million in fiscal 2011, 2010 and 2009, respectively. The Company realized gross losses on
these sales of $0.2 million, $2.0 million and $0.5 million in fiscal 2011, 2010 and 2009, respectively.
F-15