U-Haul 2011 Annual Report Download - page 59
Download and view the complete annual report
Please find page 59 of the 2011 U-Haul annual report below. You can navigate through the pages in the report by either clicking on the pages listed below, or by using the keyword search tool below to find specific information within the annual report.-
 1
1 -
2
-
3
-
4
-
5
-
6
-
7
-
8
-
9
-
10
-
11
-
12
-
13
-
14
-
15
-
16
-
17
-
18
-
19
-
20
-
21
-
22
-
23
-
24
-
25
-
26
-
27
-
28
-
29
-
30
-
31
-
32
-
33
-
34
-
35
-
36
-
37
-
38
-
39
-
40
-
41
-
42
-
43
-
44
-
45
-
46
-
47
-
48
-
 49
49 -
 50
50 -
 51
51 -
 52
52 -
 53
53 -
 54
54 -
 55
55 -
 56
56 -
 57
57 -
 58
58 -
 59
59 -
 60
60 -
 61
61 -
 62
62 -
 63
63 -
 64
64 -
 65
65 -
 66
66 -
 67
67 -
 68
68 -
 69
69 -
70
-
71
-
72
-
73
-
74
-
75
-
76
-
77
-
78
-
79
-
80
-
81
-
82
-
83
-
84
-
85
-
86
-
87
-
88
-
89
-
90
-
91
-
92
-
93
-
94
-
95
-
96
-
97
-
98
-
99
-
100
-
101
-
102
-
103
-
104
-
105
-
106
-
107
-
108
-
109
-
110
-
111
-
112
-
113
-
114
-
115
-
116
-
117
-
118
-
119
-
120
-
121
-
122
-
123
-
124
-
125
-
126
 |
 |

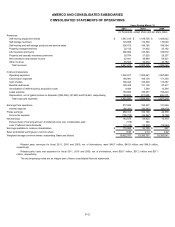
2011 2010 2009
Revenues:
Self-moving equipment rentals $ 1,547,015 $ 1,419,726 $ 1,423,022
Self-storage revenues 120,698 110,369 110,548
Self-moving and self-storage products and service sales 205,570 198,785 199,394
Property management fees 22,132 21,632 23,192
Life insurance premiums 206,992 134,345 109,572
Property and casualty insurance premiums 30,704 27,625 28,337
Net investment and interest income 52,661 49,989 58,021
Other revenue 55,503 39,534 40,180
Total revenues 2,241,275 2,002,005 1,992,266
Costs and expenses:
Operating expenses 1,026,577 1,022,061 1,057,880
Commission expenses 190,981 169,104 171,303
Cost of sales 106,024 104,049 114,387
Benefits and losses 190,429 121,105 97,617
Amortization of deferred policy acquisition costs 9,494 7,569 12,394
Lease expense 150,809 156,951 152,424
Depreciation, net of (gains) losses on disposals (($23,058), ($1,960) and $16,644, respectively) 189,266 227,629 265,213
Total costs and expenses 1,863,580 1,808,468 1,871,218
Earnings from operations 377,695 193,537 121,048
Interest expense (88,381) (93,347) (98,470)
Pretax earnings 289,314 100,190 22,578
Income tax expense (105,739) (34,567) (9,168)
Net earnings 183,575 65,623 13,410
Excess (loss) of carrying amount of preferred stock over consideration paid (178) 388 -
Less: Preferred stock dividends (12,412) (12,856) (12,963)
Earnings available to common shareholders $ 170,985 $ 53,155 $ 447
Basic and diluted earnings per common share $ 8.80 $ 2.74 $ 0.02
Weighted average common shares outstanding: Basic and diluted 19,432,781 19,386,791 19,350,041
(In thousands, except share and per share data)
Years Ended March 31,
Related party costs and expenses for fiscal 2011, 2010 and 2009, net of eliminations, were $39.7 million, $37.2 million and $37.1
million, respectively.
Related party revenues for fiscal 2011, 2010 and 2009, net of eliminations, were $46.7 million, $45.9 million and $46.9 million,
respectively.
The accompanying notes are an integral part of these consolidated financial statements.
CONSOLIDATED STATEMENTS OF OPERATIONS
AMERCO AND CONSOLIDATED SUBSIDIARIES
F-3