Starwood 2011 Annual Report Download - page 99
Download and view the complete annual report
Please find page 99 of the 2011 Starwood annual report below. You can navigate through the pages in the report by either clicking on the pages listed below, or by using the keyword search tool below to find specific information within the annual report.-
 1
1 -
2
-
3
-
4
-
5
-
6
-
7
-
8
-
9
-
10
-
11
-
12
-
13
-
14
-
15
-
16
-
17
-
18
-
19
-
20
-
21
-
22
-
23
-
24
-
25
-
26
-
27
-
28
-
29
-
30
-
31
-
32
-
33
-
34
-
35
-
36
-
37
-
38
-
39
-
40
-
41
-
42
-
43
-
44
-
45
-
46
-
47
-
48
-
49
-
50
-
51
-
52
-
53
-
54
-
55
-
56
-
57
-
58
-
59
-
60
-
61
-
62
-
63
-
64
-
65
-
66
-
67
-
68
-
69
-
70
-
71
-
72
-
73
-
74
-
75
-
76
-
77
-
78
-
79
-
80
-
81
-
82
-
83
-
84
-
85
-
86
-
87
-
88
-
 89
89 -
 90
90 -
 91
91 -
 92
92 -
 93
93 -
 94
94 -
 95
95 -
 96
96 -
 97
97 -
 98
98 -
 99
99 -
 100
100 -
 101
101 -
 102
102 -
 103
103 -
 104
104 -
 105
105 -
 106
106 -
 107
107 -
 108
108 -
 109
109 -
110
-
111
-
112
-
113
-
114
-
115
-
116
-
117
-
118
-
119
-
120
-
121
-
122
-
123
-
124
-
125
-
126
-
127
-
128
-
129
-
130
-
131
-
132
-
133
-
134
-
135
-
136
-
137
-
138
-
139
-
140
-
141
-
142
-
143
-
144
-
145
-
146
-
147
-
148
-
149
-
150
-
151
-
152
-
153
-
154
-
155
-
156
-
157
-
158
-
159
-
160
-
161
-
162
-
163
-
164
-
165
-
166
-
167
-
168
-
169
 |
 |

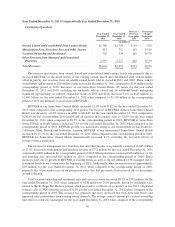
period of 2010, at approximately $14,900. Residential revenue increased approximately $125 million for the year
ended December 31, 2011 primarily due to residential sales related to the St. Regis Bal Harbour project as
discussed above.
Other revenues from managed and franchised properties increased primarily due to an increase in payroll
costs commensurate with increased occupancy at our existing managed hotels and payroll costs for the new
hotels entering the system. These revenues represent reimbursements of costs incurred on behalf of managed
hotel and vacation ownership properties and franchisees and relate primarily to payroll costs at managed
properties where we are the employer. Since the reimbursements are made based upon the costs incurred with no
added margin, these revenues and corresponding expenses have no effect on our operating income and our net
income.
Year Ended
December 31,
2011
Year Ended
December 31,
2010
Increase /
(decrease)
from prior
year
Percentage
change
from prior
year
(in millions)
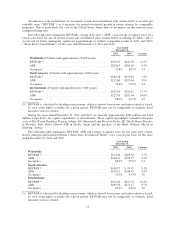
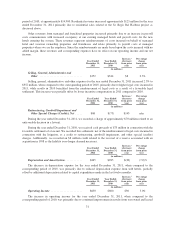
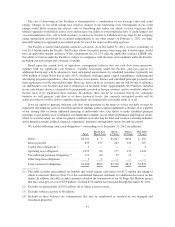
Selling, General, Administrative and
Other .............................. $352 $344 $8 2.3%
Selling, general, administrative and other expenses for the year ended December 31, 2011 increased 2.3% to
$352 million, when compared to the corresponding period of 2010, primarily due to higher legal costs incurred in
2011, while results in 2010 benefitted from the reimbursement of legal costs as a result of a favorable legal
settlement. This increase was partially offset by lower incentive compensation in 2011 compared to 2010.
Year Ended
December 31,
2011
Year Ended
December 31,
2010
Increase /
(decrease)
from prior
year
Percentage
change
from prior
year
(in millions)
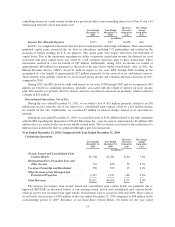
Restructuring, Goodwill Impairment and
Other Special Charges (Credits), Net ..... $68 $(75) $143 n/m
During the year ended December 31, 2011, we recorded a charge of approximately $70 million related to an
unfavorable decision in a lawsuit.
During the year ended December 31, 2010, we received cash proceeds of $75 million in connection with the
favorable settlement of a lawsuit. We recorded this settlement, net of the reimbursement of legal costs incurred in
connection with the litigation, as a credit to restructuring, goodwill impairment, and other special (credits)
charges. Additionally, we recorded an $8 million credit related to the reversal of a reserve associated with an
acquisition in 1998 as the liability is no longer deemed necessary.
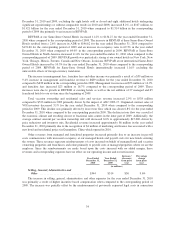
Year Ended
December 31,
2011
Year Ended
December 31,
2010
Increase /
(decrease)
from prior
year
Percentage
change
from prior
year
(in millions)
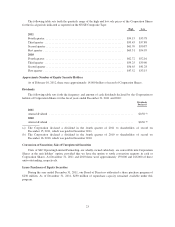
Depreciation and Amortization ............ $265 $285 $(20) (7.0)%
The decrease in depreciation expense for the year ended December 31, 2011, when compared to the
corresponding period of 2010, was primarily due to reduced depreciation expense from sold hotels, partially
offset by additional depreciation related to capital expenditures made in the last twelve months.
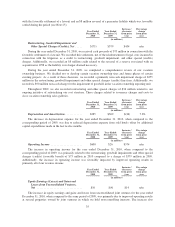
Year Ended
December 31,
2011
Year Ended
December 31,
2010
Increase /
(decrease)
from prior
year
Percentage
change
from prior
year
(in millions)
Operating Income ...................... $630 $600 $30 5.0%
The increase in operating income for the year ended December 31, 2011, when compared to the
corresponding period of 2010, was primarily due to continued improvement in results from our owned and leased
31