Starwood 2011 Annual Report Download - page 4
Download and view the complete annual report
Please find page 4 of the 2011 Starwood annual report below. You can navigate through the pages in the report by either clicking on the pages listed below, or by using the keyword search tool below to find specific information within the annual report.-
 1
1 -
 2
2 -
 3
3 -
 4
4 -
 5
5 -
 6
6 -
 7
7 -
 8
8 -
 9
9 -
 10
10 -
 11
11 -
 12
12 -
 13
13 -
 14
14 -
 15
15 -
16
-
17
-
18
-
19
-
20
-
21
-
22
-
23
-
24
-
25
-
26
-
27
-
28
-
29
-
30
-
31
-
32
-
33
-
34
-
35
-
36
-
37
-
38
-
39
-
40
-
41
-
42
-
43
-
44
-
45
-
46
-
47
-
48
-
49
-
50
-
51
-
52
-
53
-
54
-
55
-
56
-
57
-
58
-
59
-
60
-
61
-
62
-
63
-
64
-
65
-
66
-
67
-
68
-
69
-
70
-
71
-
72
-
73
-
74
-
75
-
76
-
77
-
78
-
79
-
80
-
81
-
82
-
83
-
84
-
85
-
86
-
87
-
88
-
89
-
90
-
91
-
92
-
93
-
94
-
95
-
96
-
97
-
98
-
99
-
100
-
101
-
102
-
103
-
104
-
105
-
106
-
107
-
108
-
109
-
110
-
111
-
112
-
113
-
114
-
115
-
116
-
117
-
118
-
119
-
120
-
121
-
122
-
123
-
124
-
125
-
126
-
127
-
128
-
129
-
130
-
131
-
132
-
133
-
134
-
135
-
136
-
137
-
138
-
139
-
140
-
141
-
142
-
143
-
144
-
145
-
146
-
147
-
148
-
149
-
150
-
151
-
152
-
153
-
154
-
155
-
156
-
157
-
158
-
159
-
160
-
161
-
162
-
163
-
164
-
165
-
166
-
167
-
168
-
169
 |
 |

Starwood posted another great year in 2011. We
grew REVPAR index and room count faster than
the industry. We played offense in the marketplace.
But we played it safe with our finances, as we enter
2012 with our strongest ever balance sheet. This
has been Starwood’s game plan since the crisis has
receded, and it is paying off as we further distance
ourselves from the competition and accelerate our
growth trajectory.
We delivered strong financial results despite a
turbulent global economy. As the most global
company in our industry, we witness firsthand world
events like the Arab Spring, the disaster in Japan or the
euro-zone drama. Behind those headlines, though,
we see encouraging trend lines. Our REVPAR gains
were fueled by rapid economic growth in emerging
markets and tight supply in the developed world.
The global economic recovery continued through
2011, bringing occupancies close to pre-crisis
levels. With many hotels full on weeknights and
during peak periods, we saw rates increase. For the
full year, higher rates accounted for over half of our
REVPAR gains. We are encouraged to see robust
demand for business travel, which drives 75% of our
total revenue. Corporate profits and cash on hand
are at record levels, and companies are scouring
the globe in search of growth opportunities.
Against this backdrop, here are just a few highlights
from the year:
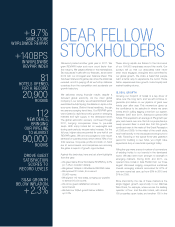
» We grew Same Store Worldwide REVPAR by 9.7%
(or 7.4% in constant dollars)
» We gained 140bps in Worldwide REVPAR index
» We opened 81 hotels, for a record
20,900 rooms
» We signed 112 new deals, bringing our pipeline
to almost 90,000 rooms
» We drove guest satisfaction scores to
record levels
» We held our SG&A growth below inflation,
up 2.3%
These strong results are thanks to the hard work
of our 154,000 employees around the world. Our
surveys tell us that our associates have never
been more engaged, energized and committed to
our global growth. We share a belief that people
want a better way to experience the world. Those
better experiences drive growth, brand loyalty and
market-leading returns.
GLOBAL GROWTH
Growing our footprint of hotels is a key driver of
value over the long term, and we will continue to
generate and deliver on our pipeline of great new
hotels year after year. This momentum gives us
the confidence to be selective in where we open
hotels and in culling lagging ones from our system.
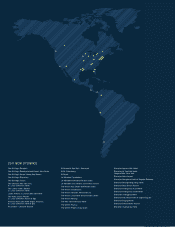
Between 2007 and 2011, Starwood opened 389
hotels. This equates to an average of 8% growth per
year, and means over one-third of our properties are
newly opened. Bear in mind also that this growth
continued even in the wake of the Great Recession
of 2008 and 2009. In the midst of the credit crisis,
new hotel activity in the developed world ground to
a halt. Factoring in the typical three-year gestation
period for building a new hotel, you might have
expected a drop in new hotel openings today.
Filling the gap were a record number of conversions
of existing hotels to our brands in the developed
world. We also went from strength to strength in
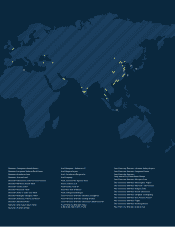
emerging markets. During 2010 and 2011, we
opened more hotels in Asia Pacific than our three
largest US-based lodging competitors combined.
Overall, emerging markets accounted for 61% of
our new rooms last year, up from 50% in 2010 and
31% in 2009.
More importantly, the rise of these markets is the
single biggest growth opportunity in our lifetimes.
Take China, for example, where we are the leading
operator of four- and five-star hotels, with almost
100 properties open today and another 100 in the
DEAR FELLOW
STOCKHOLDERS
+
9.7%
SAME STORE
WORLDWIDE REVPAR
+
140BPS
IN WORLDWIDE
REVPAR INDEX
81
HOTELS OPENED,
FOR A RECORD
20,900
ROOMS
112
NEW DEALS,
BRINGING
OUR PIPELINE
TO ALMOST
90,000
ROOMS
DROVE GUEST
SATISFACTION
SCORES TO
RECORD LEVELS
SG&A GROWTH
BELOW INFLATION,
+
2.3%