Starwood 2011 Annual Report Download - page 86
Download and view the complete annual report
Please find page 86 of the 2011 Starwood annual report below. You can navigate through the pages in the report by either clicking on the pages listed below, or by using the keyword search tool below to find specific information within the annual report.-
 1
1 -
2
-
3
-
4
-
5
-
6
-
7
-
8
-
9
-
10
-
11
-
12
-
13
-
14
-
15
-
16
-
17
-
18
-
19
-
20
-
21
-
22
-
23
-
24
-
25
-
26
-
27
-
28
-
29
-
30
-
31
-
32
-
33
-
34
-
35
-
36
-
37
-
38
-
39
-
40
-
41
-
42
-
43
-
44
-
45
-
46
-
47
-
48
-
49
-
50
-
51
-
52
-
53
-
54
-
55
-
56
-
57
-
58
-
59
-
60
-
61
-
62
-
63
-
64
-
65
-
66
-
67
-
68
-
69
-
70
-
71
-
72
-
73
-
74
-
75
-
 76
76 -
 77
77 -
 78
78 -
 79
79 -
 80
80 -
 81
81 -
 82
82 -
 83
83 -
 84
84 -
 85
85 -
 86
86 -
 87
87 -
 88
88 -
 89
89 -
 90
90 -
 91
91 -
 92
92 -
 93
93 -
 94
94 -
 95
95 -
 96
96 -
97
-
98
-
99
-
100
-
101
-
102
-
103
-
104
-
105
-
106
-
107
-
108
-
109
-
110
-
111
-
112
-
113
-
114
-
115
-
116
-
117
-
118
-
119
-
120
-
121
-
122
-
123
-
124
-
125
-
126
-
127
-
128
-
129
-
130
-
131
-
132
-
133
-
134
-
135
-
136
-
137
-
138
-
139
-
140
-
141
-
142
-
143
-
144
-
145
-
146
-
147
-
148
-
149
-
150
-
151
-
152
-
153
-
154
-
155
-
156
-
157
-
158
-
159
-
160
-
161
-
162
-
163
-
164
-
165
-
166
-
167
-
168
-
169
 |
 |

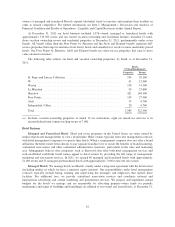
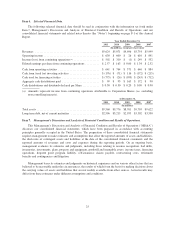
management or franchise contracts. To date, where we have sold hotels, we have not provided seller financing or
other financial assistance to buyers. Total revenues generated from our owned, leased and consolidated joint
venture hotels worldwide for the years ending December 31, 2011, 2010 and 2009 were $1.768 billion, $1.704
billion and $1.584 billion, respectively (total revenues from our owned, leased and consolidated joint venture
hotels in North America were $1.001 billion, $1.067 billion and $1.024 billion for 2011, 2010 and 2009,
respectively).
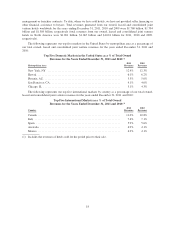
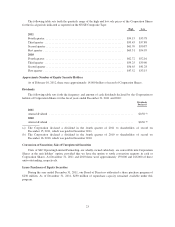
The following represents our top five markets in the United States by metropolitan area as a percentage of
our total owned, leased and consolidated joint venture revenues for the years ended December 31, 2011 and
2010:
Top Five Domestic Markets in the United States as a % of Total Owned
Revenues for the Years Ended December 31, 2011 and 2010 (1)
2011 2010
Metropolitan Area Revenues Revenues
New York, NY ................................................... 12.4% 12.3%
Hawaii .......................................................... 6.1% 6.2%
Phoenix, AZ ...................................................... 5.3% 5.0%
San Francisco, CA ................................................. 4.1% 4.0%
Chicago, IL ...................................................... 3.1% 4.3%
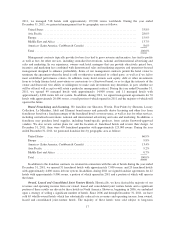
The following represents our top five international markets by country as a percentage of our total owned,
leased and consolidated joint venture revenues for the years ended December 31, 2011 and 2010:
Top Five International Markets as a % of Total Owned
Revenues for the Years Ended December 31, 2011 and 2010 (1)
2011 2010
Country Revenues Revenues
Canada .......................................................... 11.0% 10.8%
Italy ............................................................ 7.4% 7.1%
Spain ........................................................... 5.9% 5.6%
Australia ........................................................ 4.9% 4.1%
Mexico .......................................................... 4.2% 4.1%
(1) Includes the revenues of hotels sold for the period prior to their sale.
18