Starwood 2011 Annual Report Download - page 134
Download and view the complete annual report
Please find page 134 of the 2011 Starwood annual report below. You can navigate through the pages in the report by either clicking on the pages listed below, or by using the keyword search tool below to find specific information within the annual report.-
 1
1 -
2
-
3
-
4
-
5
-
6
-
7
-
8
-
9
-
10
-
11
-
12
-
13
-
14
-
15
-
16
-
17
-
18
-
19
-
20
-
21
-
22
-
23
-
24
-
25
-
26
-
27
-
28
-
29
-
30
-
31
-
32
-
33
-
34
-
35
-
36
-
37
-
38
-
39
-
40
-
41
-
42
-
43
-
44
-
45
-
46
-
47
-
48
-
49
-
50
-
51
-
52
-
53
-
54
-
55
-
56
-
57
-
58
-
59
-
60
-
61
-
62
-
63
-
64
-
65
-
66
-
67
-
68
-
69
-
70
-
71
-
72
-
73
-
74
-
75
-
76
-
77
-
78
-
79
-
80
-
81
-
82
-
83
-
84
-
85
-
86
-
87
-
88
-
89
-
90
-
91
-
92
-
93
-
94
-
95
-
96
-
97
-
98
-
99
-
100
-
101
-
102
-
103
-
104
-
105
-
106
-
107
-
108
-
109
-
110
-
111
-
112
-
113
-
114
-
115
-
116
-
117
-
118
-
119
-
120
-
121
-
122
-
123
-
 124
124 -
 125
125 -
 126
126 -
 127
127 -
 128
128 -
 129
129 -
 130
130 -
 131
131 -
 132
132 -
 133
133 -
 134
134 -
 135
135 -
 136
136 -
 137
137 -
 138
138 -
 139
139 -
 140
140 -
 141
141 -
 142
142 -
 143
143 -
 144
144 -
145
-
146
-
147
-
148
-
149
-
150
-
151
-
152
-
153
-
154
-
155
-
156
-
157
-
158
-
159
-
160
-
161
-
162
-
163
-
164
-
165
-
166
-
167
-
168
-
169
 |
 |

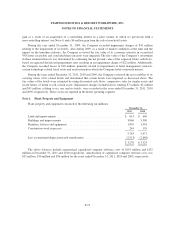
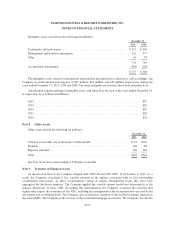
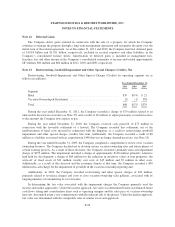
STARWOOD HOTELS & RESORTS WORLDWIDE, INC.
NOTES TO FINANCIAL STATEMENTS
will be required to be consolidated in the Company’s financial statements. In accordance with ASU No. 2009-17,
the Company concluded it is the primary beneficiary of the QSPEs and accordingly, the Company began
consolidating the QSPEs on January 1, 2010 (see Note 9). Using the carrying amounts of the assets and liabilities
of the QSPEs as prescribed by ASU No. 2009-17 and any corresponding elimination of activity between the
QSPEs and the Company resulting from the consolidation on January 1, 2010, the Company recorded a $417
million increase in total assets, a $444 million increase in total liabilities, a $26 million (net of tax) decrease in
beginning retained earnings and a $1 million decrease to stockholders equity. The Company has additional VIEs
whereby the Company was determined not to be the primary beneficiary (see Note 25).
Beginning January 1, 2010, the Company’s statements of income no longer reflect activity related to its
Retained Interests, but instead reflects activity related to its securitized vacation ownership notes receivable and
the corresponding securitized debt, including interest income, loan loss provisions, and interest expense. Interest
income and loan loss provisions associated with the securitized vacation ownership notes receivable are included
in the vacation ownership and residential sales and services line item. The cash flows from borrowings and
repayments associated with the securitized vacation ownership debt are now presented as cash flows from
financing activities. The Company does not expect to recognize gains or losses from future securitizations as a
result of the adoption of this new guidance.
While the year ended December 31, 2011 and 2010 have been accounted for under the new accounting
standards, these years are not comparable to 2009 amounts, particularly with regards to vacation ownership and
residential sales and services and interest expense.
In October 2009, the FASB issued ASU 2009-13 which supersedes certain guidance in ASC 605-25,
Revenue Recognition – Multiple Element Arrangements. This topic requires an entity to allocate arrangement
consideration at the inception of an arrangement to all of its deliverables based on their relative selling prices.
This topic is effective for annual reporting periods beginning after June 15, 2010. The Company adopted this
topic on January 1, 2011 and it did not have a material impact on its consolidated financial statements.
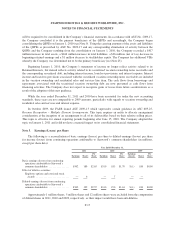
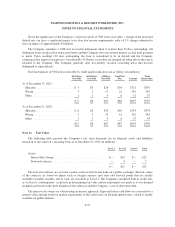
Note 3. Earnings (Losses) per Share
The following is a reconciliation of basic earnings (losses) per share to diluted earnings (losses) per share
for income (losses) from continuing operations attributable to Starwood’s common shareholders (in millions,
except per share data):
Year Ended December 31,
2011 2010 2009
Earnings Shares
Per
Share Earnings Shares
Per
Share
Earnings
(Losses) Shares
Per
Share
Basic earnings (losses) from continuing
operations attributable to Starwood’s
common shareholders ................ $502 189 $2.65 $310 183 $1.70 $ (1) 180 $0.00
Effect of dilutive securities:
Employee options and restricted stock
awards .......................... — 6 — 7 — —
Diluted earnings (losses) from continuing
operations attributable to Starwood’s
common shareholders ................ $502 195 $2.57 $310 190 $1.63 $ (1) 180 $0.00
Approximately 1 million shares, 5 million shares and 12 million shares were excluded from the computation
of diluted shares in 2011, 2010 and 2009, respectively, as their impact would have been anti-dilutive.
F-17