Starwood 2011 Annual Report Download - page 35
Download and view the complete annual report
Please find page 35 of the 2011 Starwood annual report below. You can navigate through the pages in the report by either clicking on the pages listed below, or by using the keyword search tool below to find specific information within the annual report.-
 1
1 -
2
-
3
-
4
-
5
-
6
-
7
-
8
-
9
-
10
-
11
-
12
-
13
-
14
-
15
-
16
-
17
-
18
-
19
-
20
-
21
-
22
-
23
-
24
-
 25
25 -
 26
26 -
 27
27 -
 28
28 -
 29
29 -
 30
30 -
 31
31 -
 32
32 -
 33
33 -
 34
34 -
 35
35 -
 36
36 -
 37
37 -
 38
38 -
 39
39 -
 40
40 -
 41
41 -
 42
42 -
 43
43 -
 44
44 -
 45
45 -
46
-
47
-
48
-
49
-
50
-
51
-
52
-
53
-
54
-
55
-
56
-
57
-
58
-
59
-
60
-
61
-
62
-
63
-
64
-
65
-
66
-
67
-
68
-
69
-
70
-
71
-
72
-
73
-
74
-
75
-
76
-
77
-
78
-
79
-
80
-
81
-
82
-
83
-
84
-
85
-
86
-
87
-
88
-
89
-
90
-
91
-
92
-
93
-
94
-
95
-
96
-
97
-
98
-
99
-
100
-
101
-
102
-
103
-
104
-
105
-
106
-
107
-
108
-
109
-
110
-
111
-
112
-
113
-
114
-
115
-
116
-
117
-
118
-
119
-
120
-
121
-
122
-
123
-
124
-
125
-
126
-
127
-
128
-
129
-
130
-
131
-
132
-
133
-
134
-
135
-
136
-
137
-
138
-
139
-
140
-
141
-
142
-
143
-
144
-
145
-
146
-
147
-
148
-
149
-
150
-
151
-
152
-
153
-
154
-
155
-
156
-
157
-
158
-
159
-
160
-
161
-
162
-
163
-
164
-
165
-
166
-
167
-
168
-
169
 |
 |
Total compensation for Named Executive Officers is evaluated against the peer group identified in this
proxy statement. Evaluated on this basis, the Compensation Committee believes the actual cash and equity
compensation delivered for the 2011 performance year was appropriate in light of the Company’s overall
performance and the performance of the particular executives.
We describe each of the compensation elements below and explain why we pay each element and how we
determine the amount of each element.
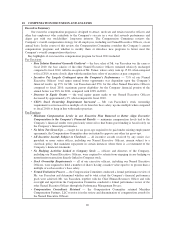
Base Salary. The Company believes it is essential to provide our Named Executive Officers with
competitive base salaries that will enable the Company to continue to attract and retain critical senior executives
from within and outside the hospitality industry. In the case of Named Executive Officers other than the Chief
Executive Officer, base salary typically accounts for approximately 20% of total compensation at target (in other
words, total compensation assuming performance goals are satisfied at targeted levels, but excluding benefits and
perquisites). In the case of Mr. van Paasschen, base salary for 2011 was $1,250,000. As a result, base salary
accounted for approximately 14% of total compensation at target for Mr. van Paasschen. Base salary serves as a
minimum level of compensation to Named Executive Officers in circumstances when achieving Company
financial and strategic/operational objectives becomes challenging and the level of incentive compensation is
impacted. Salaries for Named Executive Officers are generally based on the responsibilities of each position,
Company and individual performance, unique market demands and experience level. Salaries are reviewed
annually against similar positions among a group of peer companies developed by the Company and approved by
the Compensation Committee after consultation with Meridian, consisting of similarly-sized hotel and property
management companies as well as other companies representative of markets in which the Company competes
for key executive talent. See the section entitled Background Information on the Executive Compensation
Program — Use of Peer Data section beginning on page 34 of this proxy statement for a list of the peer
companies used in this analysis. Similar to other companies, the Company generally seeks to position base
salaries of our Named Executive Officers at or near the median base salary of the Company’s peer group for
similar positions but also reviews the range of values around the median, including the 25th and 75th percentile for
reference purposes. See additional detail regarding base salaries in the section entitled Narrative Disclosure to
Summary Compensation Table and Grants of Plan-Based Awards beginning on page 39 of this proxy
statement.
Incentive Compensation. Incentive compensation includes annual cash bonus awards under the
Company’s Executive Plan and long-term incentive compensation in the form of equity awards under the
Company’s LTIP. Incentive compensation typically accounts for approximately 80% of total compensation at
target (86% for Mr. van Paasschen in 2011), with annual cash bonus compensation and long-term incentive
compensation accounting for 19% and 61%, respectively (29% and 57% for Mr. van Paasschen, respectively, in
2011). The Company believes that this structure allows it to provide each Named Executive Officer with
substantial incentive compensation opportunities if performance objectives are met. The Company believes that
the allocation between base salary and incentive compensation is appropriate and beneficial because:
• it promotes the Company’s competitive position by allowing it to provide Named Executive Officers with
above-median total competitive compensation if targets are met;
• it targets and attracts highly motivated and talented executives within and outside the hospitality industry;
• it aligns senior management’s interests with those of stockholders;
• it promotes achievement of business and individual performance objectives; and
• it provides long-term incentives for Named Executive Officers to remain in the Company’s employ.
Annual Incentive Compensation. Annual cash bonuses are a key part of the Company’s executive
compensation program. The bonuses directly link the achievement of Company financial and strategic/
operational performance objectives to executive pay. Annual bonuses also provide a complementary balance to
25