Starwood 2011 Annual Report Download - page 155
Download and view the complete annual report
Please find page 155 of the 2011 Starwood annual report below. You can navigate through the pages in the report by either clicking on the pages listed below, or by using the keyword search tool below to find specific information within the annual report.-
 1
1 -
2
-
3
-
4
-
5
-
6
-
7
-
8
-
9
-
10
-
11
-
12
-
13
-
14
-
15
-
16
-
17
-
18
-
19
-
20
-
21
-
22
-
23
-
24
-
25
-
26
-
27
-
28
-
29
-
30
-
31
-
32
-
33
-
34
-
35
-
36
-
37
-
38
-
39
-
40
-
41
-
42
-
43
-
44
-
45
-
46
-
47
-
48
-
49
-
50
-
51
-
52
-
53
-
54
-
55
-
56
-
57
-
58
-
59
-
60
-
61
-
62
-
63
-
64
-
65
-
66
-
67
-
68
-
69
-
70
-
71
-
72
-
73
-
74
-
75
-
76
-
77
-
78
-
79
-
80
-
81
-
82
-
83
-
84
-
85
-
86
-
87
-
88
-
89
-
90
-
91
-
92
-
93
-
94
-
95
-
96
-
97
-
98
-
99
-
100
-
101
-
102
-
103
-
104
-
105
-
106
-
107
-
108
-
109
-
110
-
111
-
112
-
113
-
114
-
115
-
116
-
117
-
118
-
119
-
120
-
121
-
122
-
123
-
124
-
125
-
126
-
127
-
128
-
129
-
130
-
131
-
132
-
133
-
134
-
135
-
136
-
137
-
138
-
139
-
140
-
141
-
142
-
143
-
144
-
 145
145 -
 146
146 -
 147
147 -
 148
148 -
 149
149 -
 150
150 -
 151
151 -
 152
152 -
 153
153 -
 154
154 -
 155
155 -
 156
156 -
 157
157 -
 158
158 -
 159
159 -
 160
160 -
 161
161 -
 162
162 -
 163
163 -
 164
164 -
 165
165 -
166
-
167
-
168
-
169
 |
 |

STARWOOD HOTELS & RESORTS WORLDWIDE, INC.
NOTES TO FINANCIAL STATEMENTS
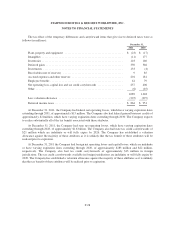
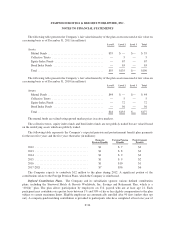
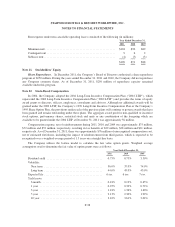
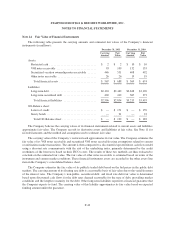
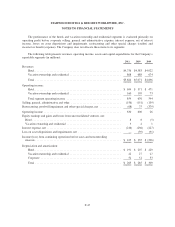
Rent expense under non-cancelable operating leases consisted of the following (in millions):
Year Ended December 31,
2011 2010 2009
Minimum rent ................................................. $104 $90 $89
Contingent rent ................................................ 9 6 2
Sublease rent .................................................. (4) (5) (3)
$109 $91 $88
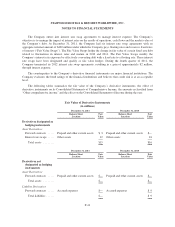
Note 21. Stockholders’ Equity
Share Repurchases. In December 2011, the Company’s Board of Directors authorized a share repurchase
program of $250 million. During the years ended December 31, 2011 and 2010, the Company did not repurchase
any Company common shares. As of December 31, 2011, $250 million of repurchase capacity remained
available under this program.
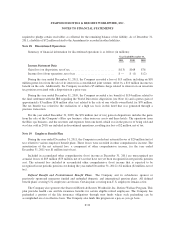
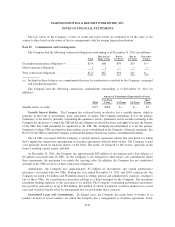
Note 22. Stock-Based Compensation
In 2004, the Company adopted the 2004 Long-Term Incentive Compensation Plan (“2004 LTIP”), which
superseded the 2002 Long-Term Incentive Compensation Plan (“2002 LTIP”) and provides the terms of equity
award grants to directors, officers, employees, consultants and advisors. Although no additional awards will be
granted under the 2002 LTIP, the Company’s 1999 Long-Term Incentive Compensation Plan or the Company’s
1995 Share Option Plan, the provisions under each of the previous plans will continue to govern awards that have
been granted and remain outstanding under those plans. The aggregate award pool for non-qualified or incentive
stock options, performance shares, restricted stock and units or any combination of the foregoing which are
available to be granted under the 2004 LTIP at December 31, 2011 was approximately 56 million.
Compensation expense, net of reimbursements during 2011, 2010 and 2009 was approximately $75 million,
$72 million and $53 million, respectively, resulting in tax benefits of $29 million, $28 million and $21 million,
respectively. As of December 31, 2011, there was approximately $76 million of unrecognized compensation cost,
net of estimated forfeitures, including the impact of reimbursement from third parties, which is expected to be
recognized over a weighted-average period of 1.5 years on a straight-line basis.
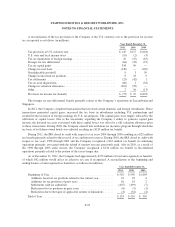
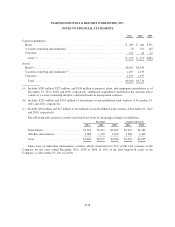
The Company utilizes the Lattice model to calculate the fair value option grants. Weighted average
assumptions used to determine the fair value of option grants were as follows:
Year Ended December 31,
2011 2010 2009
Dividend yield ....................................... 0.75% 0.75% 3.50%
Volatility:
Near term ......................................... 36.0% 37.0% 74.0%
Long term ......................................... 44.0% 45.0% 43.0%
Expected life ......................................... 6yrs. 6 yrs. 7 yrs.
Yield curve:
6 month ........................................... 0.18% 0.19% 0.45%
1 year ............................................ 0.25% 0.32% 0.72%
3 year ............................................ 1.18% 1.36% 1.40%
5 year ............................................ 2.13% 2.30% 1.99%
10 year ........................................... 3.42% 3.61% 3.02%
F-38