Starwood 2011 Annual Report Download - page 47
Download and view the complete annual report
Please find page 47 of the 2011 Starwood annual report below. You can navigate through the pages in the report by either clicking on the pages listed below, or by using the keyword search tool below to find specific information within the annual report.-
 1
1 -
2
-
3
-
4
-
5
-
6
-
7
-
8
-
9
-
10
-
11
-
12
-
13
-
14
-
15
-
16
-
17
-
18
-
19
-
20
-
21
-
22
-
23
-
24
-
25
-
26
-
27
-
28
-
29
-
30
-
31
-
32
-
33
-
34
-
35
-
36
-
 37
37 -
 38
38 -
 39
39 -
 40
40 -
 41
41 -
 42
42 -
 43
43 -
 44
44 -
 45
45 -
 46
46 -
 47
47 -
 48
48 -
 49
49 -
 50
50 -
 51
51 -
 52
52 -
 53
53 -
 54
54 -
 55
55 -
 56
56 -
 57
57 -
58
-
59
-
60
-
61
-
62
-
63
-
64
-
65
-
66
-
67
-
68
-
69
-
70
-
71
-
72
-
73
-
74
-
75
-
76
-
77
-
78
-
79
-
80
-
81
-
82
-
83
-
84
-
85
-
86
-
87
-
88
-
89
-
90
-
91
-
92
-
93
-
94
-
95
-
96
-
97
-
98
-
99
-
100
-
101
-
102
-
103
-
104
-
105
-
106
-
107
-
108
-
109
-
110
-
111
-
112
-
113
-
114
-
115
-
116
-
117
-
118
-
119
-
120
-
121
-
122
-
123
-
124
-
125
-
126
-
127
-
128
-
129
-
130
-
131
-
132
-
133
-
134
-
135
-
136
-
137
-
138
-
139
-
140
-
141
-
142
-
143
-
144
-
145
-
146
-
147
-
148
-
149
-
150
-
151
-
152
-
153
-
154
-
155
-
156
-
157
-
158
-
159
-
160
-
161
-
162
-
163
-
164
-
165
-
166
-
167
-
168
-
169
 |
 |

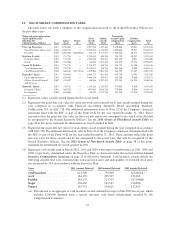
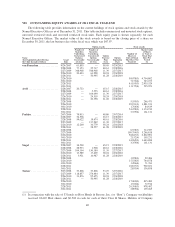
IV. 2011 SUMMARY COMPENSATION TABLE
The table below sets forth a summary of the compensation received by the Named Executive Officers for
the past three years:
Name and principal position
(listed alphabetically
following the
Chief Executive Officer) Year
Salary
($)(1)
Bonus
($)
Stock
awards
($)(2)
Option
awards
($)(3)
Non-equity
incentive plan
compensation
($)(4)
All other
compensation
($)(5)
Total
($)
Frits van Paasschen ........ 2011 1,250,000 — 3,997,530 1,125,465 2,450,000 32,863 8,855,858
Chief Executive Officer and 2010 1,208,333 — 3,956,262 1,210,395 3,000,000 19,927 9,394,917
President 2009 1,000,000 800,000(6) 150,125 5,151,077 1,700,000 60,432 8,861,634
Matthew E. Avril .......... 2011 751,750 — 1,574,435 450,186 736,715 10,557 3,523,643
President, Hotel 2010 747,292 — 1,550,838 484,167 902,100 9,901 3,694,298
Group 2009 725,000 — 44,269 1,545,324 616,250 25,654 2,956,497
Vasant M. Prabhu ......... 2011 751,750 — 2,174,427 630,256 736,715 11,198 4,304,346
Vice Chairman and 2010 733,235 — 2,312,035 726,243 902,100 9,800 4,683,413
Chief Financial Officer 2009 640,658 207,191(6) 1,298,096 1,287,769 544,559 27,085 4,005,358
Kenneth S. Siegel .......... 2011 638,490 — 1,600,725 461,442 625,720 11,981 3,338,358
Chief Administrative 2010 634,582 — 1,468,148 459,953 766,188 9,800 3,338,671
Officer, General Counsel
and Secretary
2009 615,039 — 46,166 1,957,411 522,784 26,914 3,168,314
Simon M. Turner .......... 2011 733,142 — 1,314,216 1,125,465 735,020 9,800 3,917,643
President, Global 2010 644,792 — 693,824 1,888,226 778,500 9,800 4,015,142
Development 2009 625,000 — 34,369 2,575,538 531,250 27,910 3,794,067
(1) Represents salary actually earned during the fiscal year listed.
(2) Represents the grant date fair value for restricted stock and restricted stock unit awards granted during the
year computed in accordance with Financial Accounting Standards Board Accounting Standards
Codification 718, or ASC 718. For additional information, refer to Note 22 of the Company’s financial
statements filed with the SEC as part of the Form 10-K for the year ended December 31, 2011. These
amounts reflect the grant date fair value for these awards and do not correspond to the actual value that will
be recognized by the Named Executive Officers. See the 2011 Grants of Plan-Based Awards Table on
page 38 of this proxy statement for information on awards granted in 2011.
(3) Represents the grant date fair value for stock option awards granted during the year computed in accordance
with ASC 718. For additional information, refer to Note 22 of the Company’s financial statements filed with
the SEC as part of the Form 10-K for the year ended December 31, 2011. These amounts reflect the grant
date fair value for these awards and do not correspond to the actual value that will be recognized by the
Named Executive Officers. See the 2011 Grants of Plan-Based Awards Table on page 38 of this proxy
statement for information on awards granted in 2011.
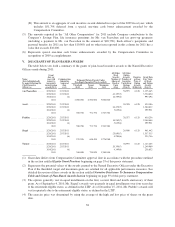
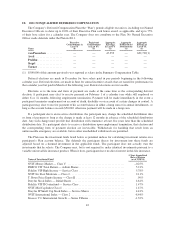
(4) Represents cash awards paid in March 2012, 2011 and 2010 with respect to performance in 2011, 2010 and
2009, respectively, determined under the Executive Plan, as discussed under the section entitled Annual
Incentive Compensation beginning on page 25 of this proxy statement. Cash incentive awards include the
following amounts that were converted into restricted stock units and such number of restricted stock units
was increased by 33% in accordance with the Executive Plan:
Name 2011 Amount Deferred 2010 Amount Deferred 2009 Amount Deferred
van Paasschen .............. 612,500 750,000 625,000(A)
Avril ...................... 184,179 225,525 154,063
Prabhu .................... 184,179 225,525 187,938(B)
Siegel ...................... 156,430 191,547 130,696
Turner .................... 183,755 194,625 132,813
(A) This amount is an aggregate of cash incentive awards deferred in respect of the 2009 fiscal year, which
includes $200,000 deferred from a special one-time cash bonus enhancement awarded by the
Compensation Committee.
37