Starwood 2011 Annual Report Download - page 93
Download and view the complete annual report
Please find page 93 of the 2011 Starwood annual report below. You can navigate through the pages in the report by either clicking on the pages listed below, or by using the keyword search tool below to find specific information within the annual report.-
 1
1 -
2
-
3
-
4
-
5
-
6
-
7
-
8
-
9
-
10
-
11
-
12
-
13
-
14
-
15
-
16
-
17
-
18
-
19
-
20
-
21
-
22
-
23
-
24
-
25
-
26
-
27
-
28
-
29
-
30
-
31
-
32
-
33
-
34
-
35
-
36
-
37
-
38
-
39
-
40
-
41
-
42
-
43
-
44
-
45
-
46
-
47
-
48
-
49
-
50
-
51
-
52
-
53
-
54
-
55
-
56
-
57
-
58
-
59
-
60
-
61
-
62
-
63
-
64
-
65
-
66
-
67
-
68
-
69
-
70
-
71
-
72
-
73
-
74
-
75
-
76
-
77
-
78
-
79
-
80
-
81
-
82
-
 83
83 -
 84
84 -
 85
85 -
 86
86 -
 87
87 -
 88
88 -
 89
89 -
 90
90 -
 91
91 -
 92
92 -
 93
93 -
 94
94 -
 95
95 -
 96
96 -
 97
97 -
 98
98 -
 99
99 -
 100
100 -
 101
101 -
 102
102 -
 103
103 -
104
-
105
-
106
-
107
-
108
-
109
-
110
-
111
-
112
-
113
-
114
-
115
-
116
-
117
-
118
-
119
-
120
-
121
-
122
-
123
-
124
-
125
-
126
-
127
-
128
-
129
-
130
-
131
-
132
-
133
-
134
-
135
-
136
-
137
-
138
-
139
-
140
-
141
-
142
-
143
-
144
-
145
-
146
-
147
-
148
-
149
-
150
-
151
-
152
-
153
-
154
-
155
-
156
-
157
-
158
-
159
-
160
-
161
-
162
-
163
-
164
-
165
-
166
-
167
-
168
-
169
 |
 |

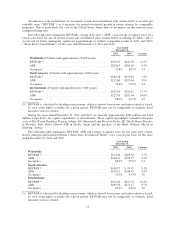
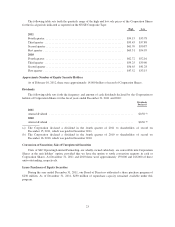
Item 6. Selected Financial Data.
The following selected financial data should be read in conjunction with the information set forth under
Item 7, Management’s Discussion and Analysis of Financial Condition and Results of Operations, and our
consolidated financial statements and related notes thereto (the “Notes”) beginning on page F-1 of this Annual
Report.
Year Ended December 31,
2011 2010 2009 2008 2007
(In millions, except per share data)
Revenues ............................................. $5,624 $5,071 $4,696 $5,754 $5,999
Operating income ....................................... $ 630 $ 600 $ 26 $ 610 $ 841
Income (loss) from continuing operations (a) .................. $ 502 $ 310 $ (1) $ 249 $ 532
Diluted earnings per share from continuing operations .......... $ 2.57 $ 1.63 $ 0.00 $ 1.34 $ 2.52
Cash from operating activities ............................. $ 641 $ 764 $ 571 $ 646 $ 884
Cash from (used for) investing activities ..................... $ (176) $ (71) $ 116 $ (172) $ (215)
Cash used for financing activities .......................... $ (775) $ (26) $ (993) $ (243) $ (712)
Aggregate cash distributions paid .......................... $ 99 $ 93 $ 165 $ 172 $ 90
Cash distributions and dividends declared per Share ............ $ 0.50 $ 0.30 $ 0.20 $ 0.90 $ 0.90
(a) Amounts represent income from continuing operations attributable to Corporation Shares (i.e. excluding
non-controlling interests).
At December 31,
2011 2010 2009 2008 2007
(In millions)
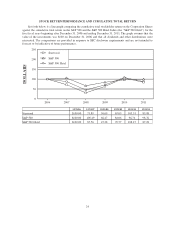
Total assets ............................................ $9,560 $9,776 $8,761 $9,703 $9,622
Long-term debt, net of current maturities .................... $2,596 $3,215 $2,955 $3,502 $3,590
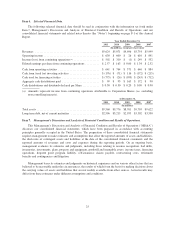
Item 7. Management’s Discussion and Analysis of Financial Condition and Results of Operations.
This Management’s Discussion and Analysis of Financial Condition and Results of Operations (“MD&A”)
discusses our consolidated financial statements, which have been prepared in accordance with accounting
principles generally accepted in the United States. The preparation of these consolidated financial statements
requires management to make estimates and assumptions that affect the reported amounts of assets and liabilities,
the disclosure of contingent assets and liabilities at the date of the consolidated financial statements and the
reported amounts of revenues and costs and expenses during the reporting periods. On an ongoing basis,
management evaluates its estimates and judgments, including those relating to revenue recognition, bad debts,
inventories, investments, plant, property and equipment, goodwill and intangible assets, income taxes, financing
operations, frequent guest program liability, self-insurance claims payable, restructuring costs, retirement
benefits and contingencies and litigation.
Management bases its estimates and judgments on historical experience and on various other factors that are
believed to be reasonable under the circumstances, the results of which form the basis for making decisions about
the carrying values of assets and liabilities that are not readily available from other sources. Actual results may
differ from these estimates under different assumptions and conditions.
25