Starwood 2011 Annual Report Download - page 102
Download and view the complete annual report
Please find page 102 of the 2011 Starwood annual report below. You can navigate through the pages in the report by either clicking on the pages listed below, or by using the keyword search tool below to find specific information within the annual report.-
 1
1 -
2
-
3
-
4
-
5
-
6
-
7
-
8
-
9
-
10
-
11
-
12
-
13
-
14
-
15
-
16
-
17
-
18
-
19
-
20
-
21
-
22
-
23
-
24
-
25
-
26
-
27
-
28
-
29
-
30
-
31
-
32
-
33
-
34
-
35
-
36
-
37
-
38
-
39
-
40
-
41
-
42
-
43
-
44
-
45
-
46
-
47
-
48
-
49
-
50
-
51
-
52
-
53
-
54
-
55
-
56
-
57
-
58
-
59
-
60
-
61
-
62
-
63
-
64
-
65
-
66
-
67
-
68
-
69
-
70
-
71
-
72
-
73
-
74
-
75
-
76
-
77
-
78
-
79
-
80
-
81
-
82
-
83
-
84
-
85
-
86
-
87
-
88
-
89
-
90
-
91
-
 92
92 -
 93
93 -
 94
94 -
 95
95 -
 96
96 -
 97
97 -
 98
98 -
 99
99 -
 100
100 -
 101
101 -
 102
102 -
 103
103 -
 104
104 -
 105
105 -
 106
106 -
 107
107 -
 108
108 -
 109
109 -
 110
110 -
 111
111 -
 112
112 -
113
-
114
-
115
-
116
-
117
-
118
-
119
-
120
-
121
-
122
-
123
-
124
-
125
-
126
-
127
-
128
-
129
-
130
-
131
-
132
-
133
-
134
-
135
-
136
-
137
-
138
-
139
-
140
-
141
-
142
-
143
-
144
-
145
-
146
-
147
-
148
-
149
-
150
-
151
-
152
-
153
-
154
-
155
-
156
-
157
-
158
-
159
-
160
-
161
-
162
-
163
-
164
-
165
-
166
-
167
-
168
-
169
 |
 |

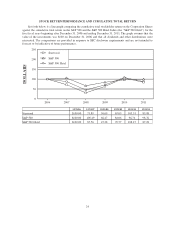
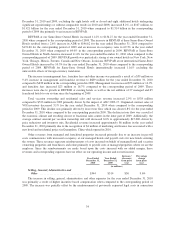
December 31, 2010 and 2009, excluding the eight hotels sold or closed and eight additional hotels undergoing
significant repositionings or without comparable results in 2010 and 2009) increased 8.2%, or $107 million, to
$1.421 billion for the year ended December 31, 2010 when compared to $1.314 billion in the corresponding
period of 2009 due primarily to an increase in REVPAR.
REVPAR at our Same-Store Owned Hotels increased 11.2% to $136.27 for the year ended December 31,
2010 when compared to the corresponding period of 2009. The increase in REVPAR at these Same-Store Owned
Hotels resulted from a 2.6% increase in ADR to $196.62 for the year ended December 31, 2010 compared to
$191.60 for the corresponding period of 2009 and an increase in occupancy rates to 69.3% in the year ended
December 31, 2010 when compared to 64.0% in the corresponding period in 2009. REVPAR at Same-Store
Owned Hotels in North America increased 11.6% for the year ended December 31, 2010 when compared to the
corresponding period of 2009. REVPAR growth was particularly strong at our owned hotels in New York, New
York, Chicago, Illinois, Toronto, Canada and New Orleans, Louisiana. REVPAR at our international Same-Store
Owned Hotels increased by 10.5% for the year ended December 31, 2010 when compared to the corresponding
period of 2009. REVPAR for Same-Store Owned Hotels internationally increased 11.6% excluding the
unfavorable effects of foreign currency translation.
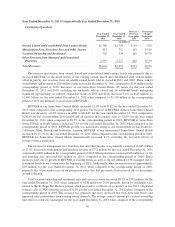
The increase in management fees, franchise fees and other income was primarily a result of a $59 million or
9.4% increase in management and franchise revenue to $689 million for the year ended December 31, 2010
compared to $630 million in the corresponding period in 2009. Management fees increased $53 million or 14.9%
and franchise fees increased $23 million or 16.7% compared to the corresponding period of 2009. These
increases were due to growth in REVPAR at existing hotels as well as the net addition of 27 managed and 65
franchised hotels to our system since the beginning of 2009.
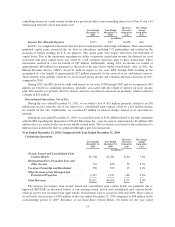
Total vacation ownership and residential sales and services revenue increased 2.9% to $538 million
compared to $523 million in 2009 primarily driven by the impact of ASU 2009-17. Originated contract sales of
VOI inventory decreased 3.1% for the year ended December 31, 2010 when compared to the corresponding
period in 2009. This decline was primarily driven by lower tour flow which was down 6.8% for the year ended
December 31, 2010 when compared to the corresponding period in 2009. The decline in tour flow was a result of
the economic climate and resulting closure of fractional sales centers in the latter part of 2009. Additionally, the
average contract amount per vacation ownership unit sold decreased 6.0% to approximately $15,000, driven by
price reductions and inventory mix. Residential revenue increased approximately $6 million in the year ended
December 31, 2010 primarily due to the recognition of $4 million of marketing and license fees associated with a
new hotel and residential project in Guangzhou, China which opened in 2010.
Other revenues from managed and franchised properties increased primarily due to an increase in payroll
costs commensurate with increased occupancy at our managed hotels and payroll costs for new hotels entering
the system. These revenues represent reimbursements of costs incurred on behalf of managed hotel and vacation
ownership properties and franchisees and relate primarily to payroll costs at managed properties where we are the
employer. Since the reimbursements are made based upon the costs incurred with no added margin, these
revenues and corresponding expenses have no effect on our operating income and our net income.
Year Ended
December 31,
2010
Year Ended
December 31,
2009
Increase /
(decrease)
from prior
year
Percentage
change
from prior
year
(in millions)
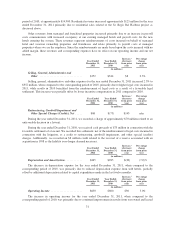
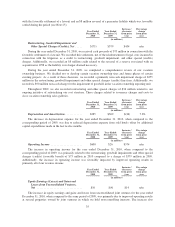
Selling, General, Administrative and
Other .............................. $344 $314 $30 9.6%
The increase in selling, general, administrative and other expenses for the year ended December 31, 2010
was primarily a result of higher incentive based compensation when compared to the corresponding period of
2009. The increase was partially offset by the reimbursement of previously expensed legal costs in connection
34