Starwood 2011 Annual Report Download - page 37
Download and view the complete annual report
Please find page 37 of the 2011 Starwood annual report below. You can navigate through the pages in the report by either clicking on the pages listed below, or by using the keyword search tool below to find specific information within the annual report.-
 1
1 -
2
-
3
-
4
-
5
-
6
-
7
-
8
-
9
-
10
-
11
-
12
-
13
-
14
-
15
-
16
-
17
-
18
-
19
-
20
-
21
-
22
-
23
-
24
-
25
-
26
-
 27
27 -
 28
28 -
 29
29 -
 30
30 -
 31
31 -
 32
32 -
 33
33 -
 34
34 -
 35
35 -
 36
36 -
 37
37 -
 38
38 -
 39
39 -
 40
40 -
 41
41 -
 42
42 -
 43
43 -
 44
44 -
 45
45 -
 46
46 -
 47
47 -
48
-
49
-
50
-
51
-
52
-
53
-
54
-
55
-
56
-
57
-
58
-
59
-
60
-
61
-
62
-
63
-
64
-
65
-
66
-
67
-
68
-
69
-
70
-
71
-
72
-
73
-
74
-
75
-
76
-
77
-
78
-
79
-
80
-
81
-
82
-
83
-
84
-
85
-
86
-
87
-
88
-
89
-
90
-
91
-
92
-
93
-
94
-
95
-
96
-
97
-
98
-
99
-
100
-
101
-
102
-
103
-
104
-
105
-
106
-
107
-
108
-
109
-
110
-
111
-
112
-
113
-
114
-
115
-
116
-
117
-
118
-
119
-
120
-
121
-
122
-
123
-
124
-
125
-
126
-
127
-
128
-
129
-
130
-
131
-
132
-
133
-
134
-
135
-
136
-
137
-
138
-
139
-
140
-
141
-
142
-
143
-
144
-
145
-
146
-
147
-
148
-
149
-
150
-
151
-
152
-
153
-
154
-
155
-
156
-
157
-
158
-
159
-
160
-
161
-
162
-
163
-
164
-
165
-
166
-
167
-
168
-
169
 |
 |

Committee retains the ability to consider whether an adjustment of the financial goals for any year is necessitated
by exceptional circumstances, for example, an unanticipated and material downturn in the business cycle that
triggers, in response, an increased focus by the Compensation Committee on the Company’s performance
relative to the industry. This ability is intended to be narrowly and infrequently used and, if applicable, the basis
for its use would be detailed in the Company’s proxy statement.
Performance against the financial goals determined 75% of Named Executive Officers’ total target annual
bonus opportunity. Subject to achieving the EP Threshold, actual bonuses paid to Named Executive Officers for
financial performance may range from 0% to 200% of the pre-determined target bonus for this category of
performance, as determined by the Compensation Committee. For Named Executive Officers, the Company
financial performance portion is based 50% on earnings per share and 50% on EBITDA of the Company.
As noted above, once the EP Threshold is achieved, the minimum and maximum annual bonus amount
specified in the Executive Plan becomes available for award. The maximum bonus payout for the applicable
Company financial performance metric is limited to 200% of target (“Maximum”) and the Compensation
Committee may apply its discretion to reduce such amount to the actual bonus amount for each Named Executive
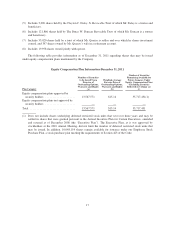
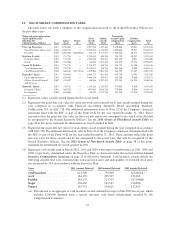
Officer. The table below sets forth for each metric the performance levels for 2011 which would have resulted in
100% bonus payout (“Target”), the minimum performance level (“Minimum”) that would have resulted in a 40%
bonus pool payout and the Maximum that would have resulted in a 200% target of bonus pool payout. In
addition, the table sets forth the approximate mid-points of payout between the Minimum to Target and Target to
Maximum and indicates the related required performance level:
Minimum
(40%)
Mid-point
(70%)
Target
(100%)
Mid-point
(150%)
Maximum
(200%)
Earnings per share ...... $ 0.99 $ 1.39 $ 1.80 $ 2.47 $ 3.15
Company EBITDA ...... $820,000,000 $923,000,000 $1,025,000,000 $1,196,000,000 $1,367,000,000
For the 2011 performance period, “adjusted” EBITDA (which exceeded the EP Threshold) for purposes of
determining annual bonuses was $1,021,000,000. EBITDA was adjusted to exclude the impact of asset sales and
changes in foreign exchange rates versus budgeted. Earnings per share from continuing operations for 2011 for
bonus purposes was $1.76 which excludes tax benefits related to non-core items partially offset by restructuring,
goodwill impairment and other special charges and debt extinguishment charges. Using the metrics described
above resulted in a payout eligibility of 98% of target for the Company financial portion of the annual bonus for
the 2011 fiscal year for the Named Executive Officers.
Strategic/Operational Goals
The strategic/operational performance goals for Named Executive Officers under the Executive Plan
consists of “Big 5” and leadership competency objectives that link individual contributions to execution of our
business strategy and major financial and operating goals. “Big 5” refers to each executive’s specific deliverables
within the Company’s critical performance categories — win with talent, execute brilliantly, build great brands,
deliver global growth, and drive outstanding results. As part of a structured process that cascades down
throughout the Company, these objectives are developed at the beginning of the year, and they integrate and align
an executive with the Company’s strategic and operational plan. Achievement of “Big 5” objectives typically
accounts for 80% of the strategic/operational performance evaluation, and achievement of leadership competency
objectives typically accounts for 20% of such evaluation. The portion of annual bonus awards attributable to
strategic/operational management performance represents 25% of Named Executive Officers’ total target. Actual
bonuses paid to Named Executive Officers for strategic/operational performance may range from 0% to 175% of
the pre-determined target amount for this category of performance, as determined by the Compensation
Committee. The strategic/operational performance goals are generally established at levels that are reasonably
difficult to achieve relative to historical trends and future expectations, and that will generally require significant
effort on the part of our Named Executive Officers to achieve.
27