Starwood 2011 Annual Report Download - page 104
Download and view the complete annual report
Please find page 104 of the 2011 Starwood annual report below. You can navigate through the pages in the report by either clicking on the pages listed below, or by using the keyword search tool below to find specific information within the annual report.-
 1
1 -
2
-
3
-
4
-
5
-
6
-
7
-
8
-
9
-
10
-
11
-
12
-
13
-
14
-
15
-
16
-
17
-
18
-
19
-
20
-
21
-
22
-
23
-
24
-
25
-
26
-
27
-
28
-
29
-
30
-
31
-
32
-
33
-
34
-
35
-
36
-
37
-
38
-
39
-
40
-
41
-
42
-
43
-
44
-
45
-
46
-
47
-
48
-
49
-
50
-
51
-
52
-
53
-
54
-
55
-
56
-
57
-
58
-
59
-
60
-
61
-
62
-
63
-
64
-
65
-
66
-
67
-
68
-
69
-
70
-
71
-
72
-
73
-
74
-
75
-
76
-
77
-
78
-
79
-
80
-
81
-
82
-
83
-
84
-
85
-
86
-
87
-
88
-
89
-
90
-
91
-
92
-
93
-
 94
94 -
 95
95 -
 96
96 -
 97
97 -
 98
98 -
 99
99 -
 100
100 -
 101
101 -
 102
102 -
 103
103 -
 104
104 -
 105
105 -
 106
106 -
 107
107 -
 108
108 -
 109
109 -
 110
110 -
 111
111 -
 112
112 -
 113
113 -
 114
114 -
115
-
116
-
117
-
118
-
119
-
120
-
121
-
122
-
123
-
124
-
125
-
126
-
127
-
128
-
129
-
130
-
131
-
132
-
133
-
134
-
135
-
136
-
137
-
138
-
139
-
140
-
141
-
142
-
143
-
144
-
145
-
146
-
147
-
148
-
149
-
150
-
151
-
152
-
153
-
154
-
155
-
156
-
157
-
158
-
159
-
160
-
161
-
162
-
163
-
164
-
165
-
166
-
167
-
168
-
169
 |
 |

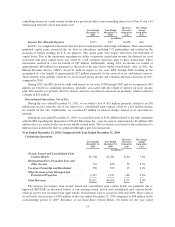
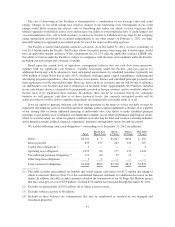
related to a charge of approximately $4 million, in 2009, related to an unfavorable mark-to-market adjustment on
a US dollar denominated loan in an unconsolidated venture in Mexico.
Year Ended
December 31,
2010
Year Ended
December 31,
2009
Increase /
(decrease)
from prior
year
Percentage
change
from prior
year
(in millions)
Net Interest Expense .................... $236 $227 $9 4.0%
The increase in net interest expense was primarily due to interest of $27 million on securitized debt related
to the adoption of ASU No. 2009-17, partially offset by certain early debt extinguishment costs of $21 million
that were incurred in 2009. Our weighted average interest rate was 6.86% at December 31, 2010 as compared to
6.73% at December 31, 2009.
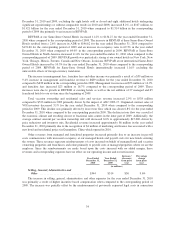
Year Ended
December 31,
2010
Year Ended
December 31,
2009
Increase /
(decrease)
from prior
year
Percentage
change
from prior
year
(in millions)
Loss on Asset Dispositions and Impairments,
Net ................................ $(39) $(91) $52 n/m
During the year ended December 31, 2010, we recorded a net loss on dispositions of approximately $39
million, primarily related to a $53 million loss on the sale of one wholly-owned hotel (see Note 5) as well as a $4
million impairment of fixed assets that were being retired in connection with a significant renovation of a
wholly-owned hotel, and a $2 million impairment on one hotel whose carrying value exceeded its fair value.
These charges were partially offset by a gain of $14 million from insurance proceeds received for a claim at a
wholly-owned hotel that suffered damage from a storm in 2008, a $5 million gain as a result of an acquisition of
a controlling interest in a joint venture in which we previously held a non-controlling interest (see Note 4) and a
$4 million gain from the sale of non-hotel assets.
During the year ended December 31, 2009, we recorded a net loss on dispositions of approximately $91
million, primarily related to $41 million of impairment charges on six hotels whose carrying values exceeded
their fair values, a $22 million impairment of our retained interests in vacation ownership mortgage receivables, a
$13 million impairment of an investment in a hotel management contract that was cancelled, a $5 million
impairment of certain technology-related fixed assets and a $4 million loss on the sale of a wholly-owned hotel.
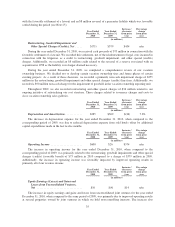
Year Ended
December 31,
2010
Year Ended
December 31,
2009
Increase /
(decrease)
from prior
year
Percentage
change
from prior
year
(in millions)
Income Tax (Benefit) Expense ............ $27 $(293) $320 n/m
The $320 million increase in income tax expense primarily related to 2009 items that did not recur in 2010,
including a $120 million deferred tax benefit for an Italian tax incentive program in which the tax basis of land
and building for the hotels we owned in Italy was stepped up to fair value in exchange for paying a current tax of
$9 million, a $51 million tax benefit related to previously unrecognized foreign tax credits for prior tax years and
a $10 million benefit to reverse the deferred interest accrual associated with the deferral of taxable income. The
remaining increase was primarily due to higher pretax income in 2010, partially offset by a benefit of $42 million
related to an IRS audit.
36