Starwood 2011 Annual Report Download - page 164
Download and view the complete annual report
Please find page 164 of the 2011 Starwood annual report below. You can navigate through the pages in the report by either clicking on the pages listed below, or by using the keyword search tool below to find specific information within the annual report.-
 1
1 -
2
-
3
-
4
-
5
-
6
-
7
-
8
-
9
-
10
-
11
-
12
-
13
-
14
-
15
-
16
-
17
-
18
-
19
-
20
-
21
-
22
-
23
-
24
-
25
-
26
-
27
-
28
-
29
-
30
-
31
-
32
-
33
-
34
-
35
-
36
-
37
-
38
-
39
-
40
-
41
-
42
-
43
-
44
-
45
-
46
-
47
-
48
-
49
-
50
-
51
-
52
-
53
-
54
-
55
-
56
-
57
-
58
-
59
-
60
-
61
-
62
-
63
-
64
-
65
-
66
-
67
-
68
-
69
-
70
-
71
-
72
-
73
-
74
-
75
-
76
-
77
-
78
-
79
-
80
-
81
-
82
-
83
-
84
-
85
-
86
-
87
-
88
-
89
-
90
-
91
-
92
-
93
-
94
-
95
-
96
-
97
-
98
-
99
-
100
-
101
-
102
-
103
-
104
-
105
-
106
-
107
-
108
-
109
-
110
-
111
-
112
-
113
-
114
-
115
-
116
-
117
-
118
-
119
-
120
-
121
-
122
-
123
-
124
-
125
-
126
-
127
-
128
-
129
-
130
-
131
-
132
-
133
-
134
-
135
-
136
-
137
-
138
-
139
-
140
-
141
-
142
-
143
-
144
-
145
-
146
-
147
-
148
-
149
-
150
-
151
-
152
-
153
-
 154
154 -
 155
155 -
 156
156 -
 157
157 -
 158
158 -
 159
159 -
 160
160 -
 161
161 -
 162
162 -
 163
163 -
 164
164 -
 165
165 -
 166
166 -
 167
167 -
 168
168 -
 169
169
 |
 |

STARWOOD HOTELS & RESORTS WORLDWIDE, INC.
NOTES TO FINANCIAL STATEMENTS
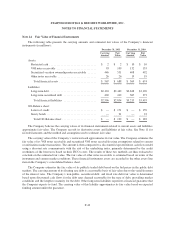
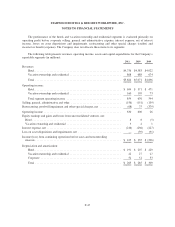
The performance of the hotels and vacation ownership and residential segments is evaluated primarily on
operating profit before corporate selling, general and administrative expense, interest expense, net of interest
income, losses on asset dispositions and impairments, restructuring and other special charges (credits) and
income tax benefit (expense). The Company does not allocate these items to its segments.
The following table presents revenues, operating income, assets and capital expenditures for the Company’s
reportable segments (in millions):
2011 2010 2009
Revenues:
Hotel ............................................................ $4,756 $4,383 $4,022
Vacation ownership and residential .................................... 868 688 674
Total ............................................................ $5,624 $5,071 $4,696
Operating income:
Hotel ............................................................ $ 694 $ 571 $ 471
Vacation ownership and residential .................................... 160 105 73
Total segment operating income ...................................... 854 676 544
Selling, general, administrative and other ................................... (156) (151) (139)
Restructuring, goodwill impairment and other special charges, net ............... (68) 75 (379)
Operating income ...................................................... 630 600 26
Equity earnings and gains and losses from unconsolidated ventures, net:
Hotel .............................................................. 8 8 (5)
Vacation ownership and residential ......................................321
Interest expense, net .................................................... (216) (236) (227)
Loss on asset dispositions and impairments, net .............................. — (39) (91)
Income (loss) from continuing operations before taxes and noncontrolling
interests ............................................................ $ 425 $ 335 $ (296)
Depreciation and amortization:
Hotel ............................................................ $ 191 $ 207 $ 229
Vacation ownership and residential .................................... 22 27 27
Corporate ........................................................ 52 51 53
Total ............................................................ $ 265 $ 285 $ 309
F-47