Starwood 2011 Annual Report Download - page 127
Download and view the complete annual report
Please find page 127 of the 2011 Starwood annual report below. You can navigate through the pages in the report by either clicking on the pages listed below, or by using the keyword search tool below to find specific information within the annual report.-
 1
1 -
2
-
3
-
4
-
5
-
6
-
7
-
8
-
9
-
10
-
11
-
12
-
13
-
14
-
15
-
16
-
17
-
18
-
19
-
20
-
21
-
22
-
23
-
24
-
25
-
26
-
27
-
28
-
29
-
30
-
31
-
32
-
33
-
34
-
35
-
36
-
37
-
38
-
39
-
40
-
41
-
42
-
43
-
44
-
45
-
46
-
47
-
48
-
49
-
50
-
51
-
52
-
53
-
54
-
55
-
56
-
57
-
58
-
59
-
60
-
61
-
62
-
63
-
64
-
65
-
66
-
67
-
68
-
69
-
70
-
71
-
72
-
73
-
74
-
75
-
76
-
77
-
78
-
79
-
80
-
81
-
82
-
83
-
84
-
85
-
86
-
87
-
88
-
89
-
90
-
91
-
92
-
93
-
94
-
95
-
96
-
97
-
98
-
99
-
100
-
101
-
102
-
103
-
104
-
105
-
106
-
107
-
108
-
109
-
110
-
111
-
112
-
113
-
114
-
115
-
116
-
 117
117 -
 118
118 -
 119
119 -
 120
120 -
 121
121 -
 122
122 -
 123
123 -
 124
124 -
 125
125 -
 126
126 -
 127
127 -
 128
128 -
 129
129 -
 130
130 -
 131
131 -
 132
132 -
 133
133 -
 134
134 -
 135
135 -
 136
136 -
 137
137 -
138
-
139
-
140
-
141
-
142
-
143
-
144
-
145
-
146
-
147
-
148
-
149
-
150
-
151
-
152
-
153
-
154
-
155
-
156
-
157
-
158
-
159
-
160
-
161
-
162
-
163
-
164
-
165
-
166
-
167
-
168
-
169
 |
 |
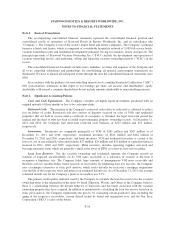
STARWOOD HOTELS & RESORTS WORLDWIDE, INC.
NOTES TO FINANCIAL STATEMENTS
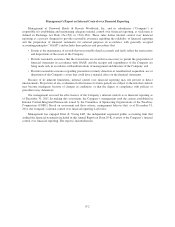
Note 1. Basis of Presentation
The accompanying consolidated financial statements represent the consolidated financial position and
consolidated results of operations of Starwood Hotels & Resorts Worldwide, Inc. and its subsidiaries (the
“Company”). The Company is one of the world’s largest hotel and leisure companies. The Company’s principal
business is hotels and leisure, which is comprised of a worldwide hospitality network of 1,089 full-service hotels,
vacation ownership resorts and residential developments primarily serving two markets: luxury and upscale. The
principal operations of Starwood Vacation Ownership, Inc. (“SVO”) include the development and operation of
vacation ownership resorts; and marketing, selling and financing vacation ownership interests (“VOIs”) in the
resorts.
The consolidated financial statements include assets, liabilities, revenues and expenses of the Company and
all of its controlled subsidiaries and partnerships. In consolidating, all material intercompany transactions are
eliminated. We have evaluated all subsequent events through the date the consolidated financial statements were
filed.
In accordance with the guidance for noncontrolling interests in Accounting Standards Codification (“ASC”)
810, Consolidation, references in this report to our earnings per share, net income, and shareholders’ equity
attributable to Starwood’s common shareholders do not include amounts attributable to noncontrolling interests.
Note 2. Significant Accounting Policies
Cash and Cash Equivalents.The Company considers all highly liquid investments purchased with an
original maturity of three months or less to be cash equivalents.
Restricted Cash. The majority of the Company’s restricted cash relates to cash used as collateral to reduce
fees on letters of credit. Restricted cash also consists of deposits received on sales of VOIs and residential
properties that are held in escrow until a certificate of occupancy is obtained, the legal rescission period has
expired and the deed of trust has been recorded in governmental property ownership records. At December 31,
2011 and 2010, the Company had short-term restricted cash balances of $232 million and $53 million,
respectively.
Inventories.Inventories are comprised principally of VOIs of $261 million and $307 million as of
December 31, 2011 and 2010, respectively, residential inventory of $521 million and $462 million at
December 31, 2011 and 2010, respectively, and hotel inventory. VOI and residential inventory is carried at the
lower of cost or net realizable value and includes $37 million, $29 million and $31 million of capitalized interest
incurred in 2011, 2010 and 2009, respectively. Hotel inventory includes operating supplies and food and
beverage inventory items which are generally valued at the lower of FIFO cost (first-in, first-out) or market.
Loan Loss Reserves. For the vacation ownership and residential segment, the Company records an
estimate of expected uncollectibility on its VOI notes receivable as a reduction of revenue at the time it
recognizes a timeshare sale. The Company holds large amounts of homogeneous VOI notes receivable and
therefore assesses uncollectibility based on pools of receivables. In estimating loan loss reserves, the Company
uses a technique referred to as static pool analysis, which tracks defaults for each year’s mortgage originations
over the life of the respective notes and projects an estimated default rate. As of December 31, 2011, the average
estimated default rate for the Company’s pools of receivables was 9.9%.
The primary credit quality indicator used by the Company to calculate the loan loss reserve for the vacation
ownership notes is the origination of the notes by brand (Sheraton, Westin, and Other) as the Company believes
there is a relationship between the default behavior of borrowers and the brand associated with the vacation
ownership property they have acquired. In addition to quantitatively calculating the loan loss reserve based on its
static pool analysis, the Company supplements the process by evaluating certain qualitative data, including the
aging of the respective receivables, current default trends by brand and origination year, and the Fair Isaac
Corporation (“FICO”) scores of the buyers.
F-10