Starwood 2011 Annual Report Download - page 165
Download and view the complete annual report
Please find page 165 of the 2011 Starwood annual report below. You can navigate through the pages in the report by either clicking on the pages listed below, or by using the keyword search tool below to find specific information within the annual report.-
 1
1 -
2
-
3
-
4
-
5
-
6
-
7
-
8
-
9
-
10
-
11
-
12
-
13
-
14
-
15
-
16
-
17
-
18
-
19
-
20
-
21
-
22
-
23
-
24
-
25
-
26
-
27
-
28
-
29
-
30
-
31
-
32
-
33
-
34
-
35
-
36
-
37
-
38
-
39
-
40
-
41
-
42
-
43
-
44
-
45
-
46
-
47
-
48
-
49
-
50
-
51
-
52
-
53
-
54
-
55
-
56
-
57
-
58
-
59
-
60
-
61
-
62
-
63
-
64
-
65
-
66
-
67
-
68
-
69
-
70
-
71
-
72
-
73
-
74
-
75
-
76
-
77
-
78
-
79
-
80
-
81
-
82
-
83
-
84
-
85
-
86
-
87
-
88
-
89
-
90
-
91
-
92
-
93
-
94
-
95
-
96
-
97
-
98
-
99
-
100
-
101
-
102
-
103
-
104
-
105
-
106
-
107
-
108
-
109
-
110
-
111
-
112
-
113
-
114
-
115
-
116
-
117
-
118
-
119
-
120
-
121
-
122
-
123
-
124
-
125
-
126
-
127
-
128
-
129
-
130
-
131
-
132
-
133
-
134
-
135
-
136
-
137
-
138
-
139
-
140
-
141
-
142
-
143
-
144
-
145
-
146
-
147
-
148
-
149
-
150
-
151
-
152
-
153
-
154
-
 155
155 -
 156
156 -
 157
157 -
 158
158 -
 159
159 -
 160
160 -
 161
161 -
 162
162 -
 163
163 -
 164
164 -
 165
165 -
 166
166 -
 167
167 -
 168
168 -
 169
169
 |
 |

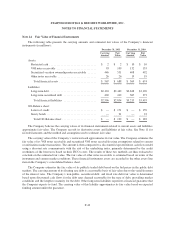
STARWOOD HOTELS & RESORTS WORLDWIDE, INC.
NOTES TO FINANCIAL STATEMENTS
2011 2010 2009
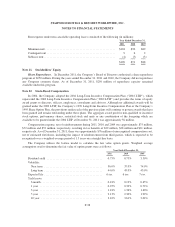
Capital expenditures:
Hotel ............................................................... $ 283 $ 184 $171
Vacation ownership and residential ....................................... 70 151 145
Corporate ............................................................ 124 42 27
Total (a) ............................................................ $ 477 $ 377 $343
Assets:
Hotel (b) ............................................................. $6,162 $6,440
Vacation ownership and residential (c) ..................................... 2,207 2,139
Corporate ............................................................ 1,191 1,197
Total ............................................................. $9,560 $9,776
(a) Includes $385 million, $227 million, and $196 million of property, plant, and equipment expenditures as of
December 31, 2011, 2010, and 2009, respectively. Additional expenditures included in the amounts above
consist of vacation ownership inventory and investments in management contracts.
(b) Includes $229 million and $294 million of investments in unconsolidated joint ventures at December 31,
2011 and 2010, respectively.
(c) Includes $30 million and $27 million of investments in unconsolidated joint ventures at December 31, 2011
and 2010, respectively.
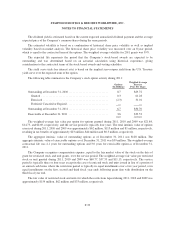
The following table presents revenues and long-lived assets by geographical region (in millions):
Revenues Long-Lived Assets
2011 2010 2009 2011 2010
United States ........................ $3,561 $3,312 $3,387 $2,023 $2,186
All other international ................. 2,063 1,759 1,309 1,506 1,449
Total ............................... $5,624 $5,071 $4,696 $3,529 $3,635
There were no individual international countries which comprised over 10% of the total revenues of the
Company for the years ended December 2011, 2010 or 2009, or 10% of the total long-lived assets of the
Company as of December 31, 2011 or 2010.
F-48