Starwood 2011 Annual Report Download - page 89
Download and view the complete annual report
Please find page 89 of the 2011 Starwood annual report below. You can navigate through the pages in the report by either clicking on the pages listed below, or by using the keyword search tool below to find specific information within the annual report.-
 1
1 -
2
-
3
-
4
-
5
-
6
-
7
-
8
-
9
-
10
-
11
-
12
-
13
-
14
-
15
-
16
-
17
-
18
-
19
-
20
-
21
-
22
-
23
-
24
-
25
-
26
-
27
-
28
-
29
-
30
-
31
-
32
-
33
-
34
-
35
-
36
-
37
-
38
-
39
-
40
-
41
-
42
-
43
-
44
-
45
-
46
-
47
-
48
-
49
-
50
-
51
-
52
-
53
-
54
-
55
-
56
-
57
-
58
-
59
-
60
-
61
-
62
-
63
-
64
-
65
-
66
-
67
-
68
-
69
-
70
-
71
-
72
-
73
-
74
-
75
-
76
-
77
-
78
-
 79
79 -
 80
80 -
 81
81 -
 82
82 -
 83
83 -
 84
84 -
 85
85 -
 86
86 -
 87
87 -
 88
88 -
 89
89 -
 90
90 -
 91
91 -
 92
92 -
 93
93 -
 94
94 -
 95
95 -
 96
96 -
 97
97 -
 98
98 -
 99
99 -
100
-
101
-
102
-
103
-
104
-
105
-
106
-
107
-
108
-
109
-
110
-
111
-
112
-
113
-
114
-
115
-
116
-
117
-
118
-
119
-
120
-
121
-
122
-
123
-
124
-
125
-
126
-
127
-
128
-
129
-
130
-
131
-
132
-
133
-
134
-
135
-
136
-
137
-
138
-
139
-
140
-
141
-
142
-
143
-
144
-
145
-
146
-
147
-
148
-
149
-
150
-
151
-
152
-
153
-
154
-
155
-
156
-
157
-
158
-
159
-
160
-
161
-
162
-
163
-
164
-
165
-
166
-
167
-
168
-
169
 |
 |

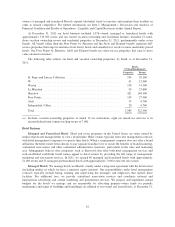
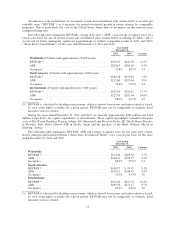
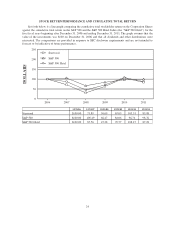
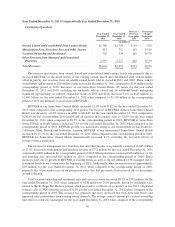
An indicator of the performance of our owned, leased and consolidated joint venture hotels is revenue per
available room (“REVPAR”), as it measures the period-over-period growth in rooms revenue for comparable
properties. This is particularly the case in the United States where there is no impact on this measure from
foreign exchange rates.
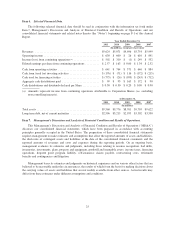
The following table summarizes REVPAR, average daily rates (“ADR”) and average occupancy rates on a
year-to-year basis for our 45 owned, leased and consolidated joint venture hotels (excluding six hotels sold or
closed and 14 hotels undergoing significant repositionings or without comparable results in 2011 and 2010)
(“Same-Store Owned Hotels”) for the years ended December 31, 2011 and 2010:
Year Ended
December 31,
2011 2010 Variance
Worldwide (45 hotels with approximately 16,000 rooms)
REVPAR (1) ........................................... $159.12 $142.76 11.5%
ADR ................................................. $218.65 $205.49 6.4%
Occupancy ............................................ 72.8% 69.5% 3.3
North America (22 hotels with approximately 9,000 rooms)
REVPAR (1) ........................................... $164.78 $153.63 7.3%
ADR ................................................. $215.60 $207.44 3.9%
Occupancy ............................................ 76.4% 74.1% 2.3
International (23 hotels with approximately 7,000 rooms)
REVPAR (1) ........................................... $152.01 $129.11 17.7%
ADR ................................................. $222.95 $202.64 10.0%
Occupancy ............................................ 68.2% 63.7% 4.5
(1) REVPAR is calculated by dividing room revenue, which is derived from rooms and suites rented or leased,
by total room nights available for a given period. REVPAR may not be comparable to similarly titled
measures such as revenues.
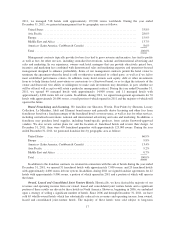
During the years ended December 31, 2011 and 2010, we invested approximately $283 million and $184
million, respectively, for capital expenditures at owned hotels. These capital expenditures included renovation
costs at The Westin Peachtree Plaza in Atlanta, GA, Sheraton Kauai Resort in Koloa, HI, The St. Regis Florence
in Florence, Italy, Hotel Alfonso XIII in Seville, Spain and the purchase of the Hotel Goldener Hirsch in
Salzburg, Austria.
The following table summarizes REVPAR, ADR and average occupancy rates for our same-store owned,
leased, managed and franchised hotels (“Same-Store Systemwide Hotels”) on a year-to-year basis for the years
ended December 31, 2011 and 2010.
Year Ended
December 31,
2011 2010 Variance
Worldwide
REVPAR (1) ............................................. $114.56 $104.43 9.7%
ADR .................................................. $168.37 $158.57 6.2%
Occupancy ............................................. 68.0% 65.9% 2.1
North America
REVPAR (1) ............................................. $108.57 $ 99.47 9.1%
ADR .................................................. $155.11 $148.45 4.5%
Occupancy ............................................. 70.0% 67.0% 3.0
International
REVPAR (1) ............................................. $123.40 $111.74 10.4%
ADR .................................................. $189.36 $174.17 8.7%
Occupancy ............................................. 65.2% 64.2% 1.0
(1) REVPAR is calculated by dividing room revenue, which is derived from rooms and suites rented or leased,
by total room nights available for a given period. REVPAR may not be comparable to similarly titled
measures such as revenues.
21