Starwood 2011 Annual Report Download - page 101
Download and view the complete annual report
Please find page 101 of the 2011 Starwood annual report below. You can navigate through the pages in the report by either clicking on the pages listed below, or by using the keyword search tool below to find specific information within the annual report.-
 1
1 -
2
-
3
-
4
-
5
-
6
-
7
-
8
-
9
-
10
-
11
-
12
-
13
-
14
-
15
-
16
-
17
-
18
-
19
-
20
-
21
-
22
-
23
-
24
-
25
-
26
-
27
-
28
-
29
-
30
-
31
-
32
-
33
-
34
-
35
-
36
-
37
-
38
-
39
-
40
-
41
-
42
-
43
-
44
-
45
-
46
-
47
-
48
-
49
-
50
-
51
-
52
-
53
-
54
-
55
-
56
-
57
-
58
-
59
-
60
-
61
-
62
-
63
-
64
-
65
-
66
-
67
-
68
-
69
-
70
-
71
-
72
-
73
-
74
-
75
-
76
-
77
-
78
-
79
-
80
-
81
-
82
-
83
-
84
-
85
-
86
-
87
-
88
-
89
-
90
-
 91
91 -
 92
92 -
 93
93 -
 94
94 -
 95
95 -
 96
96 -
 97
97 -
 98
98 -
 99
99 -
 100
100 -
 101
101 -
 102
102 -
 103
103 -
 104
104 -
 105
105 -
 106
106 -
 107
107 -
 108
108 -
 109
109 -
 110
110 -
 111
111 -
112
-
113
-
114
-
115
-
116
-
117
-
118
-
119
-
120
-
121
-
122
-
123
-
124
-
125
-
126
-
127
-
128
-
129
-
130
-
131
-
132
-
133
-
134
-
135
-
136
-
137
-
138
-
139
-
140
-
141
-
142
-
143
-
144
-
145
-
146
-
147
-
148
-
149
-
150
-
151
-
152
-
153
-
154
-
155
-
156
-
157
-
158
-
159
-
160
-
161
-
162
-
163
-
164
-
165
-
166
-
167
-
168
-
169
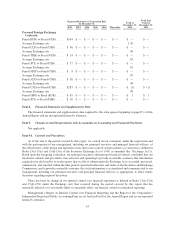
 |
 |

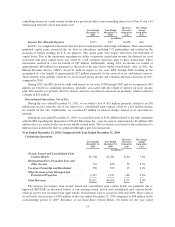
controlling interest in a joint venture in which we previously held a non-controlling interest (see Note 4) and a $4
million gain from the sale of non-hotel assets.
Year Ended
December 31,
2011
Year Ended
December 31,
2010
Increase /
(decrease)
from prior
year
Percentage
change
from prior
year
(in millions)
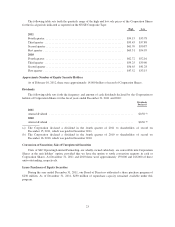
Income Tax (Benefit) Expense ............ $(75) $27 $(102) n/m
In 2011, we completed transactions that involved certain domestic and foreign subsidiaries. These transactions
generated capital gains, increased the tax basis in subsidiaries including U.S partnerships and resulted in the
inclusion of foreign earnings for U.S. tax purposes. The capital gains were largely reduced by the utilization of
capital losses. Due to the uncertainty regarding our ability to generate capital gain income, the deferred tax asset
associated with these capital losses was offset by a full valuation allowance prior to these transactions. These
transactions resulted in a net tax benefit of $87 million. Additionally, during 2011, an income tax benefit of
approximately $60 million was generated as the result of the sale of two wholly-owned hotels. Also, in 2011, the
Internal Revenue Service (“IRS”) closed its audit in respect to tax years 2004 through 2006 resulting in the
recognition of a tax benefit of approximately $25 million, primarily for the reversal of tax and interest reserves.
These benefits were partially offset by tax on increased pretax income and valuation allowance increases in 2011
compared to 2010.
During 2010, the IRS closed its audit with respect to tax years 1998 through 2003 and we recognized a $42
million tax benefit in continuing operations, primarily associated with the refund of interest on taxes already
paid. This benefit was partially offset by interest and taxes recorded on uncertain tax positions, which resulted in
a charge of $23 million.
Discontinued Operations, Net of Tax
During the year ended December 31, 2011, we recorded a loss of $13 million primarily related to an $18
million pre-tax loss from the sale of our interest in a consolidated joint venture, offset by a $10 million income
tax benefit on the sale. Additionally, we recorded $5 million of interest charges related to an uncertain tax
position.
During the year ended December 31, 2010, we recorded a gain of $134 million related to the final settlement
with the IRS regarding the disposition of World Directories Inc. a pre-tax gain of approximately $3 million ($36
million after tax) related to the sale of one wholly-owned hotel. The tax benefit was related to the realization of a
high tax basis in this hotel that was generated through a previous transaction.
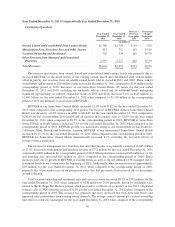
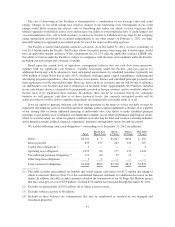
Year Ended December 31, 2010 Compared with Year Ended December 31, 2009
Continuing Operations
Year Ended
December 31,
2010
Year Ended
December 31,
2009
Increase /
(decrease)
from prior
year
Percentage
change
from prior
year
(in millions)
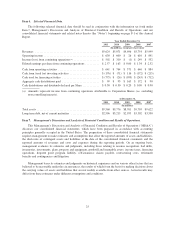
Owned, Leased and Consolidated Joint
Venture Hotels ....................... $1,704 $1,584 $120 7.6%
Management Fees, Franchise Fees and
Other Income ........................ 712 658 54 8.2%
Vacation Ownership and Residential ....... 538 523 15 2.9%
Other Revenues from Managed and
Franchised Properties ................. 2,117 1,931 186 9.6%
Total Revenues ........................ $5,071 $4,696 $375 8.0%
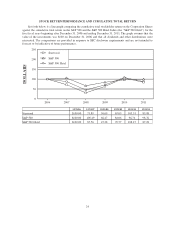
The increase in revenues from owned, leased and consolidated joint venture hotels was primarily due to
improved REVPAR (as discussed below) at our existing owned, leased and consolidated joint venture hotels,
offset in part by lost revenues from eight wholly owned hotels sold or closed in 2010 and 2009. These sold or
closed hotels had revenues of $18 million in the year ended December 31, 2010 compared to $98 million in the
corresponding period of 2009. Revenues at our Same-Store Owned Hotels (54 hotels for the year ended
33