Starwood 2011 Annual Report Download - page 91
Download and view the complete annual report
Please find page 91 of the 2011 Starwood annual report below. You can navigate through the pages in the report by either clicking on the pages listed below, or by using the keyword search tool below to find specific information within the annual report.-
 1
1 -
2
-
3
-
4
-
5
-
6
-
7
-
8
-
9
-
10
-
11
-
12
-
13
-
14
-
15
-
16
-
17
-
18
-
19
-
20
-
21
-
22
-
23
-
24
-
25
-
26
-
27
-
28
-
29
-
30
-
31
-
32
-
33
-
34
-
35
-
36
-
37
-
38
-
39
-
40
-
41
-
42
-
43
-
44
-
45
-
46
-
47
-
48
-
49
-
50
-
51
-
52
-
53
-
54
-
55
-
56
-
57
-
58
-
59
-
60
-
61
-
62
-
63
-
64
-
65
-
66
-
67
-
68
-
69
-
70
-
71
-
72
-
73
-
74
-
75
-
76
-
77
-
78
-
79
-
80
-
 81
81 -
 82
82 -
 83
83 -
 84
84 -
 85
85 -
 86
86 -
 87
87 -
 88
88 -
 89
89 -
 90
90 -
 91
91 -
 92
92 -
 93
93 -
 94
94 -
 95
95 -
 96
96 -
 97
97 -
 98
98 -
 99
99 -
 100
100 -
 101
101 -
102
-
103
-
104
-
105
-
106
-
107
-
108
-
109
-
110
-
111
-
112
-
113
-
114
-
115
-
116
-
117
-
118
-
119
-
120
-
121
-
122
-
123
-
124
-
125
-
126
-
127
-
128
-
129
-
130
-
131
-
132
-
133
-
134
-
135
-
136
-
137
-
138
-
139
-
140
-
141
-
142
-
143
-
144
-
145
-
146
-
147
-
148
-
149
-
150
-
151
-
152
-
153
-
154
-
155
-
156
-
157
-
158
-
159
-
160
-
161
-
162
-
163
-
164
-
165
-
166
-
167
-
168
-
169
 |
 |

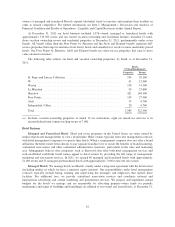
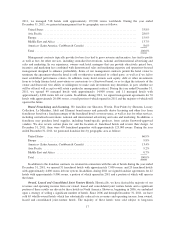
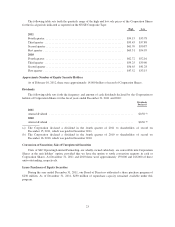
The following table sets forth the quarterly range of the high and low sale prices of the Corporation Shares
for the fiscal periods indicated as reported on the NYSE Composite Tape:
High Low
2011
Fourth quarter ...................................................... $54.15 $35.78
Third quarter ....................................................... $59.45 $37.88
Second quarter ...................................................... $61.70 $50.87
First quarter ........................................................ $65.51 $54.95
2010
Fourth quarter ...................................................... $62.72 $52.16
Third quarter ....................................................... $54.25 $39.60
Second quarter ...................................................... $56.65 $41.28
First quarter ........................................................ $47.52 $33.15
Approximate Number of Equity Security Holders
As of February 10, 2012, there were approximately 14,000 holders of record of Corporation Shares.
Dividends
The following table sets forth the frequency and amount of cash dividends declared by the Corporation to
holders of Corporation Shares for the fiscal years ended December 31, 2011 and 2010:
Dividends
Declared
2011
Annual dividend ........................................................... $0.50 (a)
2010
Annual dividend ........................................................... $0.30 (b)
(a) The Corporation declared a dividend in the fourth quarter of 2011 to shareholders of record on
December 15, 2011, which was paid in December 2011.
(b) The Corporation declared a dividend in the fourth quarter of 2010 to shareholders of record on
December 16, 2010, which was paid in December 2010.
Conversion of Securities; Sale of Unregistered Securities
Units of SLC Operating Limited Partnership, our wholly-owned subsidiary, are convertible into Corporation
Shares at the unit holders’ option, provided that we have the option to settle conversion requests in cash or
Corporation Shares. At December 31, 2011 and 2010 there were approximately 159,000 and 166,000 of these
units outstanding, respectively.
Issuer Purchases of Equity Securities
During the year ended December 31, 2011, our Board of Directors authorized a share purchase program of
$250 million. As of December 31, 2011, $250 million of repurchase capacity remained available under this
program.
23