Shaw 2012 Annual Report Download - page 93
Download and view the complete annual report
Please find page 93 of the 2012 Shaw annual report below. You can navigate through the pages in the report by either clicking on the pages listed below, or by using the keyword search tool below to find specific information within the annual report.
Shaw Communications Inc.
NOTES TO CONSOLIDATED FINANCIAL STATEMENTS
August 31, 2012 and 2011
[all amounts in millions of Canadian dollars except share and per share amounts]
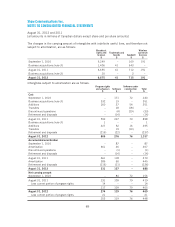
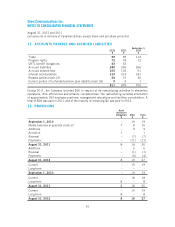
The changes in the carrying amount of intangibles with indefinite useful lives, and therefore not
subject to amortization, are as follows:
Broadcast
rights and
licenses
Trademark and
brands Goodwill
Wireless
spectrum
licenses
$$$$
September 1, 2010 5,249 – 169 191
Business acquisitions [note 3] 1,406 41 543 –
August 31, 2011 6,655 41 712 191
Business acquisitions [note 3] 20 – 3 –
August 31, 2012 6,675 41 715 191
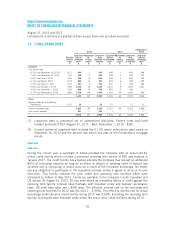
Intangibles subject to amortization are as follows:
Program rights
and advances Software
Software under
construction Total
$$$$
Cost
September 1, 2010 – 171 72 243
Business acquisitions [note 3] 332 19 – 351
Additions 260 37 54 351
Transfers – 18 (18) –
Discontinued operations – (4) (29) (33)
Retirement and disposals – (14) – (14)
August 31, 2011 592 227 79 898
Business acquisitions [note 3] 1– – 1
Additions 427 52 16 495
Transfers – 19 (19) –
Retirement and disposals (215) (22) – (237)
August 31, 2012 805 276 76 1,157
Accumulated amortization
September 1, 2010 – 87 – 87
Amortization 361 46 – 407
Discontinued operations – (1) – (1)
Retirement and disposals – (14) – (14)
August 31, 2011 361 118 – 479
Amortization 385 60 – 445
Retirement and disposals (215) (21) – (236)
August 31, 2012 531 157 – 688
Net carrying amount
September 1, 2010 – 84 72 156
August 31, 2011 231 109 79 419
Less current portion of program rights 14 – – 14
217 109 79 405
August 31, 2012 274 119 76 469
Less current portion of program rights 21 – – 21
253 119 76 448
89


