Shaw 2012 Annual Report Download - page 115
Download and view the complete annual report
Please find page 115 of the 2012 Shaw annual report below. You can navigate through the pages in the report by either clicking on the pages listed below, or by using the keyword search tool below to find specific information within the annual report.-
 1
1 -
2
-
3
-
4
-
5
-
6
-
7
-
8
-
9
-
10
-
11
-
12
-
13
-
14
-
15
-
16
-
17
-
18
-
19
-
20
-
21
-
22
-
23
-
24
-
25
-
26
-
27
-
28
-
29
-
30
-
31
-
32
-
33
-
34
-
35
-
36
-
37
-
38
-
39
-
40
-
41
-
42
-
43
-
44
-
45
-
46
-
47
-
48
-
49
-
50
-
51
-
52
-
53
-
54
-
55
-
56
-
57
-
58
-
59
-
60
-
61
-
62
-
63
-
64
-
65
-
66
-
67
-
68
-
69
-
70
-
71
-
72
-
73
-
74
-
75
-
76
-
77
-
78
-
79
-
80
-
81
-
82
-
83
-
84
-
85
-
86
-
87
-
88
-
89
-
90
-
91
-
92
-
93
-
94
-
95
-
96
-
97
-
98
-
99
-
100
-
101
-
102
-
103
-
104
-
 105
105 -
 106
106 -
 107
107 -
 108
108 -
 109
109 -
 110
110 -
 111
111 -
 112
112 -
 113
113 -
 114
114 -
 115
115 -
 116
116 -
 117
117 -
 118
118 -
 119
119 -
 120
120 -
 121
121 -
 122
122 -
 123
123 -
 124
124 -
 125
125 -
126
-
127
-
128
-
129
-
130
-
131
-
132
-
133
-
134
 |
 |

Shaw Communications Inc.
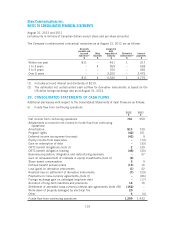
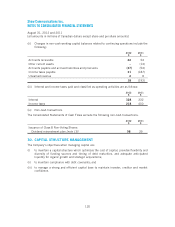
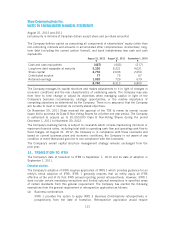
NOTES TO CONSOLIDATED FINANCIAL STATEMENTS
August 31, 2012 and 2011
[all amounts in millions of Canadian dollars except share and per share amounts]
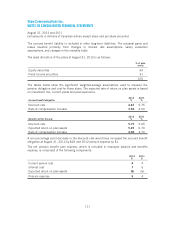
The accrued benefit liability is included in other long-term liabilities. The actuarial gains and
losses resulted primarily from changes in interest rate assumptions, salary escalation
assumptions, and changes in the mortality table.
The asset allocation of the plans at August 31, 2012 is as follows:
% of plan
assets
Equity securities 69
Fixed income securities 31
100
The tables below show the significant weighted-average assumptions used to measure the
pension obligation and cost for these plans. The expected rate of return on plan assets is based
on investment mix, current yields and past experience.
Accrued benefit obligation
2012
%
2011
%
Discount rate 4.67 5.75
Rate of compensation increase 3.50 4.00
Benefit cost for the year
2012
%
2011
%
Discount rate 5.75 5.65
Expected return on plan assets 5.25 6.70
Rate of compensation increase 4.00 3.70
A one percentage point decrease in the discount rate would have increased the accrued benefit
obligation at August 31, 2012 by $26 and 2012 pension expense by $1.
The net pension benefit plan expense, which is included in employee salaries and benefits
expense, is comprised of the following components:
2012
$
2011
$
Current service cost 44
Interest cost 76
Expected return on plan assets (6) (6)
Pension expense 54
111