Shaw 2012 Annual Report Download - page 101
Download and view the complete annual report
Please find page 101 of the 2012 Shaw annual report below. You can navigate through the pages in the report by either clicking on the pages listed below, or by using the keyword search tool below to find specific information within the annual report.-
 1
1 -
2
-
3
-
4
-
5
-
6
-
7
-
8
-
9
-
10
-
11
-
12
-
13
-
14
-
15
-
16
-
17
-
18
-
19
-
20
-
21
-
22
-
23
-
24
-
25
-
26
-
27
-
28
-
29
-
30
-
31
-
32
-
33
-
34
-
35
-
36
-
37
-
38
-
39
-
40
-
41
-
42
-
43
-
44
-
45
-
46
-
47
-
48
-
49
-
50
-
51
-
52
-
53
-
54
-
55
-
56
-
57
-
58
-
59
-
60
-
61
-
62
-
63
-
64
-
65
-
66
-
67
-
68
-
69
-
70
-
71
-
72
-
73
-
74
-
75
-
76
-
77
-
78
-
79
-
80
-
81
-
82
-
83
-
84
-
85
-
86
-
87
-
88
-
89
-
90
-
 91
91 -
 92
92 -
 93
93 -
 94
94 -
 95
95 -
 96
96 -
 97
97 -
 98
98 -
 99
99 -
 100
100 -
 101
101 -
 102
102 -
 103
103 -
 104
104 -
 105
105 -
 106
106 -
 107
107 -
 108
108 -
 109
109 -
 110
110 -
 111
111 -
112
-
113
-
114
-
115
-
116
-
117
-
118
-
119
-
120
-
121
-
122
-
123
-
124
-
125
-
126
-
127
-
128
-
129
-
130
-
131
-
132
-
133
-
134
 |
 |

Shaw Communications Inc.
NOTES TO CONSOLIDATED FINANCIAL STATEMENTS
August 31, 2012 and 2011
[all amounts in millions of Canadian dollars except share and per share amounts]
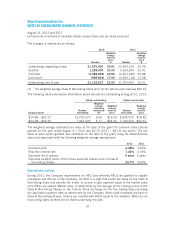
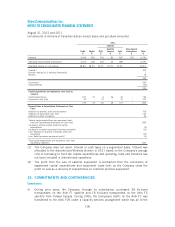
The changes in options are as follows:
2012 2011
Number
Weighted
average
exercise
price
$ Number
Weighted
average
exercise
price
$
Outstanding, beginning of year 21,970,400 20.91 23,993,150 20.48
Granted 1,229,000 21.05 3,269,000 20.91
Forfeited (1,066,925) 20.96 (2,601,632) 20.88
Exercised(1) (969,803) 17.09 (2,690,118) 17.08
Outstanding, end of year 21,162,672 21.09 21,970,400 20.91
(1) The weighted average Class B Non-Voting Share price for the options exercised was $20.67.
The following table summarizes information about the options outstanding at August 31, 2012:
Options outstanding Options exerciseable
Range of prices
Number
outstanding
Weighted
average
remaining
contractual
life
Weighted
average
exercise
price
Number
exercisable
Weighted
average
exercise
price
$14.85 – $22.27 13,720,672 6.50 $19.29 8,304,972 $18.82
$22.28 – $26.20 7,442,000 5.17 $24.42 7,139,250 $24.51
The weighted average estimated fair value at the date of the grant for common share options
granted for the year ended August 31, 2012 was $2.72 (2011 – $3.13) per option. The fair
value of each option granted was estimated on the date of the grant using the Black-Scholes
option pricing model with the following weighted-average assumptions:
2012 2011
Dividend yield 4.48% 4.32%
Risk-free interest rate 1.42% 2.19%
Expected life of options 5 years 5 years
Expected volatility factor of the future expected market price of Class B
Non-Voting Shares 24.7% 25.8%
Restricted share unit plan
During 2011, the Company implemented an RSU plan whereby RSUs are granted to eligible
employees and officers of the Company. An RSU is a right that tracks the value of one Class B
Non-Voting Share and permits the holder to receive a cash payment equal to the market value
once RSUs are vested. Market value is determined by the average of the closing prices of the
Class B Non-Voting Shares on the Toronto Stock Exchange for the five trading days preceding
the applicable payment date as determined by the Company. When cash dividends are paid on
Class B Non-Voting Shares, holders are credited with RSUs equal to the dividend. RSUs do not
have voting rights as there are no shares underlying the plan.
97