Shaw 2012 Annual Report Download - page 55
Download and view the complete annual report
Please find page 55 of the 2012 Shaw annual report below. You can navigate through the pages in the report by either clicking on the pages listed below, or by using the keyword search tool below to find specific information within the annual report.-
 1
1 -
2
-
3
-
4
-
5
-
6
-
7
-
8
-
9
-
10
-
11
-
12
-
13
-
14
-
15
-
16
-
17
-
18
-
19
-
20
-
21
-
22
-
23
-
24
-
25
-
26
-
27
-
28
-
29
-
30
-
31
-
32
-
33
-
34
-
35
-
36
-
37
-
38
-
39
-
40
-
41
-
42
-
43
-
44
-
 45
45 -
 46
46 -
 47
47 -
 48
48 -
 49
49 -
 50
50 -
 51
51 -
 52
52 -
 53
53 -
 54
54 -
 55
55 -
 56
56 -
 57
57 -
 58
58 -
 59
59 -
 60
60 -
 61
61 -
 62
62 -
 63
63 -
 64
64 -
 65
65 -
66
-
67
-
68
-
69
-
70
-
71
-
72
-
73
-
74
-
75
-
76
-
77
-
78
-
79
-
80
-
81
-
82
-
83
-
84
-
85
-
86
-
87
-
88
-
89
-
90
-
91
-
92
-
93
-
94
-
95
-
96
-
97
-
98
-
99
-
100
-
101
-
102
-
103
-
104
-
105
-
106
-
107
-
108
-
109
-
110
-
111
-
112
-
113
-
114
-
115
-
116
-
117
-
118
-
119
-
120
-
121
-
122
-
123
-
124
-
125
-
126
-
127
-
128
-
129
-
130
-
131
-
132
-
133
-
134
 |
 |

Shaw Communications Inc.
MANAGEMENT’S DISCUSSION AND ANALYSIS
August 31, 2012
Intangibles increased $63 million due to higher program rights and advances and the broadcast
licenses recorded on the acquisition of Mystery and The Cave. Program rights and advances
(current and noncurrent) increased as advances and additional investment in acquired rights
exceeded the amortization for the current year. The increase in goodwill of $3 million is due to
the aforementioned acquisition of Mystery and The Cave.
Current liabilities were up $250 million due to increases in income taxes payable of $32
million and current portion of long-term debt of $450 million partially offset by decreases in
accounts payable and accrued liabilities of $67 million, other current liability of $161 million
and derivative instruments of $7 million. Income taxes payable increased due to the current
year provision partially offset by tax installment payments. The current portion of long-term debt
increased and long-term debt decreased due to the reclassification of the 6.1% $450 million
senior notes which were repaid at maturity on November 16, 2012. Accounts payable and
accrued liabilities decreased due to lower trade and other payables primarily in respect of
timing of payment of capital expenditures and inventory and a reduction in the current portion
of the CRTC benefit obligations. The other liability decreased due to settlement of previously
amended cross-currency interest rate agreements and derivative instruments decreased due to
settlement of contracts.
Other long-term liabilities were up $45 million due to an increase in employee benefit plans of
$71 million, primarily as a result of actuarial losses recorded in the current year, partially
reduced by a decrease in CRTC benefit obligations of $22 million.
Deferred credits were up $5 million due to an increase in deferred equipment revenue partially
offset by amortization of deferred IRU revenue.
Deferred income tax liabilities, net of deferred income tax assets, decreased $63 million due to
the current year recovery.
Shareholders’ equity increased $357 million primarily due to increases in share capital of $117
million, retained earnings of $291 million and non-controlling interests of $9 million partially
offset by an increase in accumulated other comprehensive loss of $64 million. Share capital
increased due to the issuance of 5,972,349 Class B Non-Voting Shares under the Company’s
option plan and DRIP. As of November 15, 2012, share capital is as reported at August 31,
2012 with the exception of the issuance of a total of 1,274,017 Class B Non-Voting Shares
under the DRIP and upon exercise of options under the Company’s option plan subsequent to
the year end. Retained earnings increased due to current year earnings of $728 million partially
offset by dividends of $437 million while non-controlling interests increased as their share of
earnings exceeded the distributions declared during the year. Accumulated other
comprehensive loss increased due to the actuarial losses recorded on employee benefit plans.
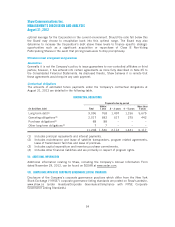
V. CONSOLIDATED CASH FLOW ANALYSIS
Operating activities
(In $millions Cdn) 2012 2011
Change
%
Funds flow from continuing operations 1,299 1,433 (9.4)
Net decrease (increase) in non-cash working capital balances
related to continuing operations 18 (192) >100.0
1,317 1,241 6.1
51