Shaw 2012 Annual Report Download - page 46
Download and view the complete annual report
Please find page 46 of the 2012 Shaw annual report below. You can navigate through the pages in the report by either clicking on the pages listed below, or by using the keyword search tool below to find specific information within the annual report.-
 1
1 -
2
-
3
-
4
-
5
-
6
-
7
-
8
-
9
-
10
-
11
-
12
-
13
-
14
-
15
-
16
-
17
-
18
-
19
-
20
-
21
-
22
-
23
-
24
-
25
-
26
-
27
-
28
-
29
-
30
-
31
-
32
-
33
-
34
-
35
-
 36
36 -
 37
37 -
 38
38 -
 39
39 -
 40
40 -
 41
41 -
 42
42 -
 43
43 -
 44
44 -
 45
45 -
 46
46 -
 47
47 -
 48
48 -
 49
49 -
 50
50 -
 51
51 -
 52
52 -
 53
53 -
 54
54 -
 55
55 -
 56
56 -
57
-
58
-
59
-
60
-
61
-
62
-
63
-
64
-
65
-
66
-
67
-
68
-
69
-
70
-
71
-
72
-
73
-
74
-
75
-
76
-
77
-
78
-
79
-
80
-
81
-
82
-
83
-
84
-
85
-
86
-
87
-
88
-
89
-
90
-
91
-
92
-
93
-
94
-
95
-
96
-
97
-
98
-
99
-
100
-
101
-
102
-
103
-
104
-
105
-
106
-
107
-
108
-
109
-
110
-
111
-
112
-
113
-
114
-
115
-
116
-
117
-
118
-
119
-
120
-
121
-
122
-
123
-
124
-
125
-
126
-
127
-
128
-
129
-
130
-
131
-
132
-
133
-
134
 |
 |

Shaw Communications Inc.
MANAGEMENT’S DISCUSSION AND ANALYSIS
August 31, 2012
ŠDuring 2012 the Company increased the dividend rate on Shaw’s Class A
Participating Shares and Class B Non-Voting Participating Shares to an equivalent
dividend rate of $0.9675 and $0.97 respectively. Dividends paid in 2012
increased approximately 6% over 2011 to $416 million.
ŠDuring the year the Company opened retail stores in Calgary, Vancouver and
Richmond offering a new retail experience as part of its continued investment in
defining the customer experience. The new stores showcase all of Shaw’s products
and services through a unique technology experience of interactive displays along
with hands on training and technical support.
ŠIn October 2010 Shaw completed its acquisition of the broadcasting business of
Canwest including CW Media, the company that owned the specialty channels
acquired from Alliance Atlantis Communications Inc. in 2007. The total
consideration, including debt assumed, was approximately $2.0 billion.
ŠOn December 7, 2010 the Company issued $500 million senior notes at a rate of
5.5% due December 7, 2020 and issued an additional $400 million under the
reopened 6.75% senior notes due November 9, 2039. The net proceeds from the
notes issuances were used to repay borrowings under the Company’s $1 billion
revolving credit facility.
ŠOn February 17, 2011 the Company issued an additional $400 million under the
reopened 6.75% senior notes due November 9, 2039. The net proceeds were used
for working capital and general corporate purposes as well as to partially repay
borrowings under the revolving credit facility while excess funds are held in cash
and cash equivalents.
ŠIn March 2011 Shaw implemented various cost saving initiatives including staff
reductions and a review of overhead expenses to drive efficiencies and enhance
competitiveness.
ŠOn May 31, 2011 the Company issued 12,000,000 Cumulative Redeemable Rate
Reset Preferred Shares, Series A (“Preferred Shares”) at a price of $25.00 per
Preferred Share for aggregate gross proceeds of $300 million. The net proceeds
were used for working capital and general corporate purposes while excess funds are
held in cash and cash equivalents.
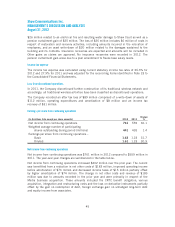
Revenue and operating expenses
Consolidated revenue of $5.00 billion for the twelve month period improved 5.4% over the prior
year. The improvement was primarily due to twelve months of revenue from Shaw Media, as well
as rate increases and growth in the Cable and Satellite divisions. Consolidated operating income
before amortization of $2.13 billion increased 3.7% over last year. The improvement was
primarily due to the current period including twelve months of Shaw Media.
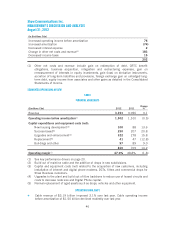
Amortization
(In $millions Cdn) 2012 2011
Change
%
Amortization revenue (expense) –
Deferred equipment revenue 115 107 7.5
Deferred equipment costs (231) (205) 12.7
Property, plant and equipment, intangibles and other (692) (637) 8.6
42