Shaw 2012 Annual Report Download - page 45
Download and view the complete annual report
Please find page 45 of the 2012 Shaw annual report below. You can navigate through the pages in the report by either clicking on the pages listed below, or by using the keyword search tool below to find specific information within the annual report.-
 1
1 -
2
-
3
-
4
-
5
-
6
-
7
-
8
-
9
-
10
-
11
-
12
-
13
-
14
-
15
-
16
-
17
-
18
-
19
-
20
-
21
-
22
-
23
-
24
-
25
-
26
-
27
-
28
-
29
-
30
-
31
-
32
-
33
-
34
-
 35
35 -
 36
36 -
 37
37 -
 38
38 -
 39
39 -
 40
40 -
 41
41 -
 42
42 -
 43
43 -
 44
44 -
 45
45 -
 46
46 -
 47
47 -
 48
48 -
 49
49 -
 50
50 -
 51
51 -
 52
52 -
 53
53 -
 54
54 -
 55
55 -
56
-
57
-
58
-
59
-
60
-
61
-
62
-
63
-
64
-
65
-
66
-
67
-
68
-
69
-
70
-
71
-
72
-
73
-
74
-
75
-
76
-
77
-
78
-
79
-
80
-
81
-
82
-
83
-
84
-
85
-
86
-
87
-
88
-
89
-
90
-
91
-
92
-
93
-
94
-
95
-
96
-
97
-
98
-
99
-
100
-
101
-
102
-
103
-
104
-
105
-
106
-
107
-
108
-
109
-
110
-
111
-
112
-
113
-
114
-
115
-
116
-
117
-
118
-
119
-
120
-
121
-
122
-
123
-
124
-
125
-
126
-
127
-
128
-
129
-
130
-
131
-
132
-
133
-
134
 |
 |

Shaw Communications Inc.
MANAGEMENT’S DISCUSSION AND ANALYSIS
August 31, 2012
III. RESULTS OF OPERATIONS
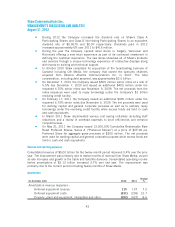
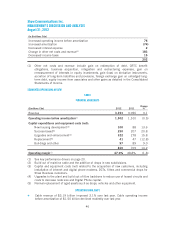
OVERVIEW OF FISCAL 2012 CONSOLIDATED RESULTS
Change
(In $millions Cdn except per share amounts) 2012 2011 2010(3)
2012
%
2011
%
Operations:
Revenue 4,998 4,741 3,718 5.4 27.5
Operating income before amortization(1) 2,127 2,051 1,760 3.7 16.5
Operating margin(1) 42.6% 43.3% 47.3%
Funds flow from continuing operations(2) 1,299 1,433 1,377 (9.4) 4.1
Net income from continuing operations 761 559 534 36.1 4.7
Free cash flow(1) 482 617 515 (21.9) 19.8
Balance sheet:
Total assets 12,722 12,588 10,154
Long-term financial liabilities (including current
portion)
Long-term debt 5,263 5,257 3,983
Derivative instruments 1887
Other financial liabilities 7171 159
Per share data:
Earnings per share from continuing operations
Basic 1.62 1.23 1.23
Diluted 1.61 1.23 1.23
Weighted average number of participating
shares outstanding during period (millions) 441 435 433
Cash dividends declared per share
Class A 0.9550 0.9075 0.8675
Class B 0.9575 0.9100 0.8700
(1) See key performance drivers on page 20.
(2) Funds flow from continuing operations is presented before changes in non-cash working
capital as presented in the Consolidated Statements of Cash Flows.
(3) 2010 comparative figures have not been restated for adoption of IFRS on September 1,
2010.
Highlights
ŠNet income from continuing operations was $761 million for the year compared to
$559 million in 2011.
ŠEarnings per share from continuing operations were $1.62 compared to $1.23 in
2011.
ŠRevenue for the year improved 5.4% to $5.00 billion from $4.74 billion last year.
ŠOperating income before amortization of $2.13 billion was up 3.7% over last year’s
amount of $2.05 billion.
ŠConsolidated free cash flow was $482 million compared to $617 million in 2011.
41