Shaw 2012 Annual Report Download - page 51
Download and view the complete annual report
Please find page 51 of the 2012 Shaw annual report below. You can navigate through the pages in the report by either clicking on the pages listed below, or by using the keyword search tool below to find specific information within the annual report.-
 1
1 -
2
-
3
-
4
-
5
-
6
-
7
-
8
-
9
-
10
-
11
-
12
-
13
-
14
-
15
-
16
-
17
-
18
-
19
-
20
-
21
-
22
-
23
-
24
-
25
-
26
-
27
-
28
-
29
-
30
-
31
-
32
-
33
-
34
-
35
-
36
-
37
-
38
-
39
-
40
-
 41
41 -
 42
42 -
 43
43 -
 44
44 -
 45
45 -
 46
46 -
 47
47 -
 48
48 -
 49
49 -
 50
50 -
 51
51 -
 52
52 -
 53
53 -
 54
54 -
 55
55 -
 56
56 -
 57
57 -
 58
58 -
 59
59 -
 60
60 -
 61
61 -
62
-
63
-
64
-
65
-
66
-
67
-
68
-
69
-
70
-
71
-
72
-
73
-
74
-
75
-
76
-
77
-
78
-
79
-
80
-
81
-
82
-
83
-
84
-
85
-
86
-
87
-
88
-
89
-
90
-
91
-
92
-
93
-
94
-
95
-
96
-
97
-
98
-
99
-
100
-
101
-
102
-
103
-
104
-
105
-
106
-
107
-
108
-
109
-
110
-
111
-
112
-
113
-
114
-
115
-
116
-
117
-
118
-
119
-
120
-
121
-
122
-
123
-
124
-
125
-
126
-
127
-
128
-
129
-
130
-
131
-
132
-
133
-
134
 |
 |
Shaw Communications Inc.
MANAGEMENT’S DISCUSSION AND ANALYSIS
August 31, 2012
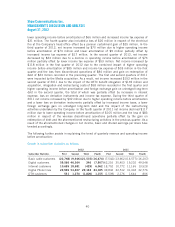
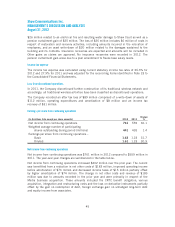
ŠDigital customers increased 98,469 during the year to 1,917,857 and penetration of
Basic is now 86.4%, up from 79.5% at August 31, 2011.
ŠDigital Phone lines increased 130,703 to 1,363,744 lines and Internet was up 34,999
to total 1,912,230 as at August 31, 2012. During the year Basic cable subscribers
decreased 70,703.
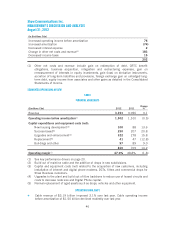
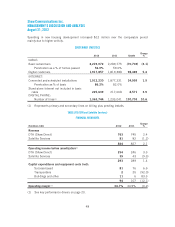
Cable revenue for 2012 of $3.19 billion improved 3.1% over the prior year. Rate increases and
customer growth in Internet and Digital Phone, including Business growth, partially offset by
lower Basic cable subscribers, accounted for the improvement.
Operating income before amortization of $1.50 billion declined modestly over the prior year.
The revenue related improvement was offset by higher employee related amounts, programming
costs, and various other expenses.
As at August 31, 2012 Shaw had 1,912,230 Internet customers which represents an 86%
penetration of Basic.
In pursuit of Shaw’s continued improvement for its approximately 1.9 million Internet
customers, the Company announced as part of its WiFi strategy a technical trial of HotSpot 2.0
in conjunction with Cisco Systems (“Cisco”), Shaw’s WiFi technology partner. HotSpot 2.0
provides a significant improvement in WiFi accessibility and security, and allows Shaw’s
broadband WiFi enabled customers to automatically connect and authenticate to the WiFi
network. The Company is now offering WiFi at over 1,500 sites in Calgary, Edmonton,
Vancouver, Victoria and Winnipeg.
Shaw recently introduced content offerings for its TV Everywhere applications with the
introduction of Shaw Go. The Shaw Go Movie Central app for Apple devices provides access to
current and library content for Shaw customers who subscribe to Movie Central programming,
including HBO Canada titles. The app provides several features that enhance the user
experience, including intelligent streaming, which provides the most optimal video quality
based on Internet connection speed, and video bookmarking, which allows customers to stop
and resume video playback at their convenience. The Shaw Go NFL Sunday Ticket app provides
Shaw NFL Sunday Ticket subscribers with live broadcasts of up to 14 NFL regular season
games along with interactive features, such as instant replay and play-by-play summaries. Shaw
customers have the added benefit of being able to access content on Shaw’s WiFi network.
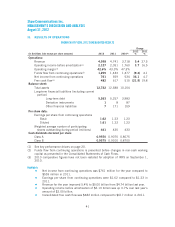
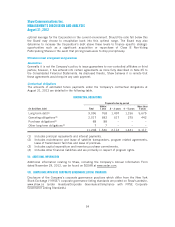
Total capital investment of $810 million increased $101 million compared to 2011. Success
based capital increased $43 million mainly due to higher subsidies on sales of HDPVRs
resulting from increased volumes and lower customer pricing, and investment in DOCSIS 3.0
WiFi internet modems, partially offset by lower HDPVR rentals and phone modem purchases.
Investment in Upgrades and enhancement and Replacement categories combined increased
$38 million compared to last year. The current period included higher spending on hub
upgrades, network electronics related to the DNU, Digital Phone infrastructure to support
Business growth, as well as investment related to the strategic WiFi build.
Buildings and other increased $8 million compared to the prior year. The current year increase
was mainly due to facility investment related to the Calgary data centre, customer service
centres and new retail locations. The prior year also benefitted from proceeds from the sale of
redundant real estate assets.
47