Shaw 2012 Annual Report Download - page 128
Download and view the complete annual report
Please find page 128 of the 2012 Shaw annual report below. You can navigate through the pages in the report by either clicking on the pages listed below, or by using the keyword search tool below to find specific information within the annual report.-
 1
1 -
2
-
3
-
4
-
5
-
6
-
7
-
8
-
9
-
10
-
11
-
12
-
13
-
14
-
15
-
16
-
17
-
18
-
19
-
20
-
21
-
22
-
23
-
24
-
25
-
26
-
27
-
28
-
29
-
30
-
31
-
32
-
33
-
34
-
35
-
36
-
37
-
38
-
39
-
40
-
41
-
42
-
43
-
44
-
45
-
46
-
47
-
48
-
49
-
50
-
51
-
52
-
53
-
54
-
55
-
56
-
57
-
58
-
59
-
60
-
61
-
62
-
63
-
64
-
65
-
66
-
67
-
68
-
69
-
70
-
71
-
72
-
73
-
74
-
75
-
76
-
77
-
78
-
79
-
80
-
81
-
82
-
83
-
84
-
85
-
86
-
87
-
88
-
89
-
90
-
91
-
92
-
93
-
94
-
95
-
96
-
97
-
98
-
99
-
100
-
101
-
102
-
103
-
104
-
105
-
106
-
107
-
108
-
109
-
110
-
111
-
112
-
113
-
114
-
115
-
116
-
117
-
 118
118 -
 119
119 -
 120
120 -
 121
121 -
 122
122 -
 123
123 -
 124
124 -
 125
125 -
 126
126 -
 127
127 -
 128
128 -
 129
129 -
 130
130 -
 131
131 -
 132
132 -
 133
133 -
 134
134
 |
 |

Shaw Communications Inc.
NOTES TO CONSOLIDATED FINANCIAL STATEMENTS
August 31, 2012 and 2011
[all amounts in millions of Canadian dollars except share and per share amounts]
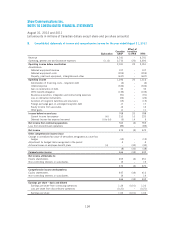
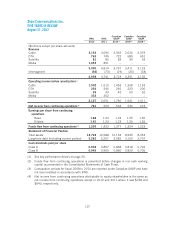
B. Consolidated statements of income and comprehensive income for the year ended August 31, 2011
Explanation
Canadian
GAAP
Effect of
transition
to IFRS IFRS
Revenue 4,741 – 4,741
Operating, general and administrative expenses (i), (ii) 2,710 (20) 2,690
Operating income before amortization 2,031 20 2,051
Amortization:
Deferred equipment revenue 107 – 107
Deferred equipment costs (205) – (205)
Property, plant and equipment, intangibles and other (637) – (637)
Operating income 1,296 20 1,316
Amortization of financing costs – long-term debt (4) – (4)
Interest expense (332) – (332)
Gain on redemption of debt 33 – 33
CRTC benefit obligation (139) – (139)
Business acquisition, integration and restructuring expenses (91) – (91)
Loss on derivative instruments (22) – (22)
Accretion of long-term liabilities and provisions (15) – (15)
Foreign exchange gain on unhedged long-term debt 17 – 17
Equity income from associates 14 – 14
Other gains 11 – 11
Income before income taxes 768 20 788
Current income tax expense (iii) 210 10 220
Deferred income tax expense (recovery) (i) to (iii) (5) 14 9
Net income from continuing operations 563 (4) 559
Loss from discontinued operations (89) – (89)
Net income 474 (4) 470
Other comprehensive income (loss)
Change in unrealized fair value of derivatives designated as cash flow
hedges (12) – (12)
Adjustment for hedged items recognized in the period 4 – 4
Actuarial losses on employee benefit plans (ii) – (30) (30)
(8) (30) (38)
Comprehensive income 466 (34) 432
Net income attributable to:
Equity shareholders 455 (4) 451
Non-controlling interests in subsidiaries 19 – 19
474 (4) 470
Comprehensive income attributable to:
Equity shareholders 447 (34) 413
Non-controlling interests in subsidiaries 19 – 19
466 (34) 432
Earnings per share – basic and diluted
Earnings per share from continuing operations 1.24 (0.01) 1.23
Loss per share from discontinued operations (0.21) – (0.21)
Earnings per share 1.03 (0.01) 1.02
124