Shaw 2012 Annual Report Download - page 69
Download and view the complete annual report
Please find page 69 of the 2012 Shaw annual report below. You can navigate through the pages in the report by either clicking on the pages listed below, or by using the keyword search tool below to find specific information within the annual report.-
 1
1 -
2
-
3
-
4
-
5
-
6
-
7
-
8
-
9
-
10
-
11
-
12
-
13
-
14
-
15
-
16
-
17
-
18
-
19
-
20
-
21
-
22
-
23
-
24
-
25
-
26
-
27
-
28
-
29
-
30
-
31
-
32
-
33
-
34
-
35
-
36
-
37
-
38
-
39
-
40
-
41
-
42
-
43
-
44
-
45
-
46
-
47
-
48
-
49
-
50
-
51
-
52
-
53
-
54
-
55
-
56
-
57
-
58
-
 59
59 -
 60
60 -
 61
61 -
 62
62 -
 63
63 -
 64
64 -
 65
65 -
 66
66 -
 67
67 -
 68
68 -
 69
69 -
 70
70 -
 71
71 -
 72
72 -
 73
73 -
 74
74 -
 75
75 -
 76
76 -
 77
77 -
 78
78 -
 79
79 -
80
-
81
-
82
-
83
-
84
-
85
-
86
-
87
-
88
-
89
-
90
-
91
-
92
-
93
-
94
-
95
-
96
-
97
-
98
-
99
-
100
-
101
-
102
-
103
-
104
-
105
-
106
-
107
-
108
-
109
-
110
-
111
-
112
-
113
-
114
-
115
-
116
-
117
-
118
-
119
-
120
-
121
-
122
-
123
-
124
-
125
-
126
-
127
-
128
-
129
-
130
-
131
-
132
-
133
-
134
 |
 |

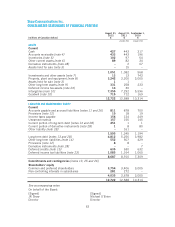
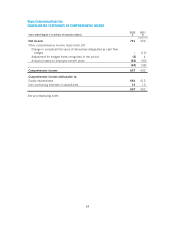
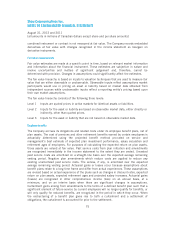
Shaw Communications Inc.
CONSOLIDATED STATEMENTS OF CHANGES IN SHAREHOLDERS’ EQUITY
Year ended August 31, 2012
Attributable to equity shareholders
[millions of Canadian dollars]
Share
capital
Contributed
surplus
Retained
earnings
Accumulated
other
comprehensive
loss Total
Equity
attributable
to non-
controlling
interests
Total
equity
Balance as at September 1,
2011 2,633 73 729 (29) 3,406 272 3,678
Net income – – 728 – 728 33 761
Other comprehensive loss – – – (64) (64) – (64)
Comprehensive income (loss) – – 728 (64) 664 33 697
Dividends – – (339) – (339) – (339)
Dividend reinvestment plan 98 – (98) – – – –
Shares issued under stock
option plan 19 (2) – – 17 – 17
Share-based compensation –6 – – 6 – 6
Distributions declared by
subsidiaries to
non-controlling interests – – – – – (24) (24)
Balance as at August 31,
2012 2,750 77 1,020 (93) 3,754 281 4,035
Year ended August 31, 2011
Attributable to equity shareholders
[millions of Canadian dollars]
Share
capital
Contributed
surplus
Retained
earnings
Accumulated
other
comprehensive
income (loss) Total
Equity
attributable
to non-
controlling
interests
Total
equity
Balance as at September 1,
2010 2,250 67 679 9 3,005 – 3,005
Business acquisition – – – – – 277 277
Net income – – 451 – 451 19 470
Other comprehensive loss – – – (38) (38) – (38)
Comprehensive income (loss) – – 451 (38) 413 19 432
Dividends – – (362) – (362) – (362)
Dividend reinvestment plan 39 – (39) – – – –
Issue of preferred shares 300 – – – 300 – 300
Share issue costs (net of taxes) (7) – – – (7) – (7)
Shares issued under stock
option plan 51 (5) – – 46 – 46
Share-based compensation – 11 – – 11 – 11
Distributions declared by
subsidiaries to
non-controlling interests – – – – – (24) (24)
Balance as at August 31,
2011 2,633 73 729 (29) 3,406 272 3,678
See accompanying notes
65