Shaw 2012 Annual Report Download - page 91
Download and view the complete annual report
Please find page 91 of the 2012 Shaw annual report below. You can navigate through the pages in the report by either clicking on the pages listed below, or by using the keyword search tool below to find specific information within the annual report.-
 1
1 -
2
-
3
-
4
-
5
-
6
-
7
-
8
-
9
-
10
-
11
-
12
-
13
-
14
-
15
-
16
-
17
-
18
-
19
-
20
-
21
-
22
-
23
-
24
-
25
-
26
-
27
-
28
-
29
-
30
-
31
-
32
-
33
-
34
-
35
-
36
-
37
-
38
-
39
-
40
-
41
-
42
-
43
-
44
-
45
-
46
-
47
-
48
-
49
-
50
-
51
-
52
-
53
-
54
-
55
-
56
-
57
-
58
-
59
-
60
-
61
-
62
-
63
-
64
-
65
-
66
-
67
-
68
-
69
-
70
-
71
-
72
-
73
-
74
-
75
-
76
-
77
-
78
-
79
-
80
-
 81
81 -
 82
82 -
 83
83 -
 84
84 -
 85
85 -
 86
86 -
 87
87 -
 88
88 -
 89
89 -
 90
90 -
 91
91 -
 92
92 -
 93
93 -
 94
94 -
 95
95 -
 96
96 -
 97
97 -
 98
98 -
 99
99 -
 100
100 -
 101
101 -
102
-
103
-
104
-
105
-
106
-
107
-
108
-
109
-
110
-
111
-
112
-
113
-
114
-
115
-
116
-
117
-
118
-
119
-
120
-
121
-
122
-
123
-
124
-
125
-
126
-
127
-
128
-
129
-
130
-
131
-
132
-
133
-
134
 |
 |

Shaw Communications Inc.
NOTES TO CONSOLIDATED FINANCIAL STATEMENTS
August 31, 2012 and 2011
[all amounts in millions of Canadian dollars except share and per share amounts]
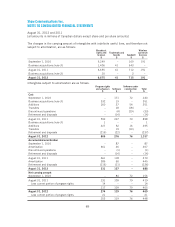
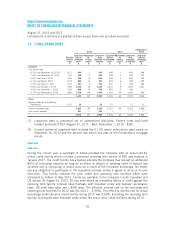
8. PROPERTY, PLANT AND EQUIPMENT
Cable and
telecommunications
distribution system
Digital
cable
terminals
and
modems
Satellite
audio,
video and
data
network
and DTH
receiving
equipment
Transmitters,
broadcasting,
communications
and production
equipment
Land
and
buildings
Data
processing
and other
Assets
under
construction Total
$$$$$$$$
Cost
September 1, 2010 4,198 552 154 – 406 311 124 5,745
Additions 387 174 9 15 12 55 113 765
Business acquisitions 8 – – 63 53 26 – 150
Transfers – – – – 5 21 (26) –
Assets held for resale – – – – – – (16) (16)
Discontinued
operations – – – – – – (77) (77)
Retirement and
disposals (244) (78) (2) (2) (12) (59) (7) (404)
August 31, 2011 4,349 648 161 76 464 354 111 6,163
Additions 441 167 3 13 11 38 42 715
Transfers 21 – – – 2 19 (42) –
Write-down – – – – (23) (8) – (31)
Retirement and
disposals (414) (96) (79) (1) (6) (38) (4) (638)
August 31, 2012 4,397 719 85 88 448 365 107 6,209
Accumulated
amortization
September 1, 2010 2,129 224 115 – 121 151 – 2,740
Amortization 358 152 16 12 20 46 – 604
Retirement and
disposals (243) (78) (2) (1) (3) (54) – (381)
August 31, 2011 2,244 298 129 11 138 143 – 2,963
Amortization 380 165 11 14 21 52 – 643
Write-down – – – – (7) (4) – (11)
Retirement and
disposals (414) (96) (79) (1) (6) (32) – (628)
August 31, 2012 2,210 367 61 24 146 159 – 2,967
Net carrying amount
September 1, 2010 2,069 328 39 – 285 160 124 3,005
August 31, 2011 2,105 350 32 65 326 211 111 3,200
August 31, 2012 2,187 352 24 64 302 206 107 3,242
In 2012, the Company recognized a gain (loss) of ($1) (2011 – $4) on the disposal of property, plant
and equipment.
87