Shaw 2012 Annual Report Download - page 52
Download and view the complete annual report
Please find page 52 of the 2012 Shaw annual report below. You can navigate through the pages in the report by either clicking on the pages listed below, or by using the keyword search tool below to find specific information within the annual report.-
 1
1 -
2
-
3
-
4
-
5
-
6
-
7
-
8
-
9
-
10
-
11
-
12
-
13
-
14
-
15
-
16
-
17
-
18
-
19
-
20
-
21
-
22
-
23
-
24
-
25
-
26
-
27
-
28
-
29
-
30
-
31
-
32
-
33
-
34
-
35
-
36
-
37
-
38
-
39
-
40
-
41
-
 42
42 -
 43
43 -
 44
44 -
 45
45 -
 46
46 -
 47
47 -
 48
48 -
 49
49 -
 50
50 -
 51
51 -
 52
52 -
 53
53 -
 54
54 -
 55
55 -
 56
56 -
 57
57 -
 58
58 -
 59
59 -
 60
60 -
 61
61 -
 62
62 -
63
-
64
-
65
-
66
-
67
-
68
-
69
-
70
-
71
-
72
-
73
-
74
-
75
-
76
-
77
-
78
-
79
-
80
-
81
-
82
-
83
-
84
-
85
-
86
-
87
-
88
-
89
-
90
-
91
-
92
-
93
-
94
-
95
-
96
-
97
-
98
-
99
-
100
-
101
-
102
-
103
-
104
-
105
-
106
-
107
-
108
-
109
-
110
-
111
-
112
-
113
-
114
-
115
-
116
-
117
-
118
-
119
-
120
-
121
-
122
-
123
-
124
-
125
-
126
-
127
-
128
-
129
-
130
-
131
-
132
-
133
-
134
 |
 |

Shaw Communications Inc.
MANAGEMENT’S DISCUSSION AND ANALYSIS
August 31, 2012
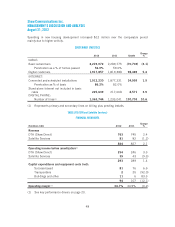
Spending in new housing development increased $12 million over the comparable period
mainly due to higher activity.
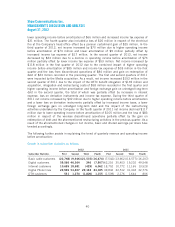
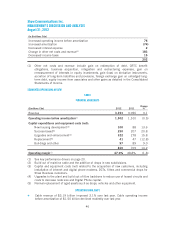
SUBSCRIBER STATISTICS
2012 2011 Growth
Change
%
CABLE:
Basic subscribers 2,219,072 2,289,775 (70,703) (3.1)
Penetration as a % of homes passed 56.0% 59.0%
Digital customers 1,917,857 1,819,388 98,469 5.4
INTERNET:
Connected and scheduled installations 1,912,230 1,877,231 34,999 1.9
Penetration as % of basic 86.2% 82.0%
Stand-alone Internet not included in basic
cable 225,639 217,068 8,571 3.9
DIGITAL PHONE:
Number of lines(1) 1,363,744 1,233,041 130,703 10.6
(1) Represents primary and secondary lines on billing plus pending installs.
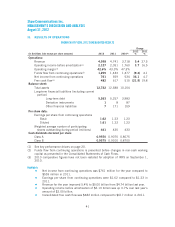
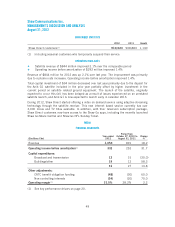
SATELLITE (DTH and Satellite Services)
FINANCIAL HIGHLIGHTS
($millions Cdn) 2012 2011
Change
%
Revenue
DTH (Shaw Direct) 763 745 2.4
Satellite Services 81 82 (1.2)
844 827 2.1
Operating income before amortization(1)
DTH (Shaw Direct) 254 246 3.3
Satellite Services 39 43 (9.3)
293 289 1.4
Capital expenditures and equipment costs (net):
Success-based 81 76 6.6
Transponders 225 (92.0)
Buildings and other 11 6 83.3
94 107 (12.1)
Operating margin(1) 34.7% 34.9% (0.2)
(1) See key performance drivers on page 20.
48