Shaw 2012 Annual Report Download - page 103
Download and view the complete annual report
Please find page 103 of the 2012 Shaw annual report below. You can navigate through the pages in the report by either clicking on the pages listed below, or by using the keyword search tool below to find specific information within the annual report.-
 1
1 -
2
-
3
-
4
-
5
-
6
-
7
-
8
-
9
-
10
-
11
-
12
-
13
-
14
-
15
-
16
-
17
-
18
-
19
-
20
-
21
-
22
-
23
-
24
-
25
-
26
-
27
-
28
-
29
-
30
-
31
-
32
-
33
-
34
-
35
-
36
-
37
-
38
-
39
-
40
-
41
-
42
-
43
-
44
-
45
-
46
-
47
-
48
-
49
-
50
-
51
-
52
-
53
-
54
-
55
-
56
-
57
-
58
-
59
-
60
-
61
-
62
-
63
-
64
-
65
-
66
-
67
-
68
-
69
-
70
-
71
-
72
-
73
-
74
-
75
-
76
-
77
-
78
-
79
-
80
-
81
-
82
-
83
-
84
-
85
-
86
-
87
-
88
-
89
-
90
-
91
-
92
-
 93
93 -
 94
94 -
 95
95 -
 96
96 -
 97
97 -
 98
98 -
 99
99 -
 100
100 -
 101
101 -
 102
102 -
 103
103 -
 104
104 -
 105
105 -
 106
106 -
 107
107 -
 108
108 -
 109
109 -
 110
110 -
 111
111 -
 112
112 -
 113
113 -
114
-
115
-
116
-
117
-
118
-
119
-
120
-
121
-
122
-
123
-
124
-
125
-
126
-
127
-
128
-
129
-
130
-
131
-
132
-
133
-
134
 |
 |

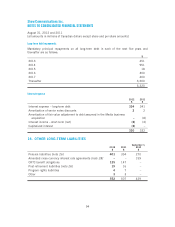
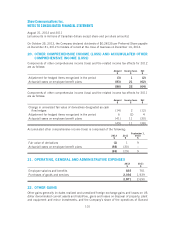
Shaw Communications Inc.
NOTES TO CONSOLIDATED FINANCIAL STATEMENTS
August 31, 2012 and 2011
[all amounts in millions of Canadian dollars except share and per share amounts]
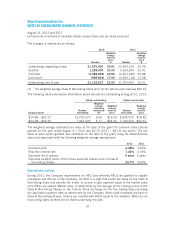
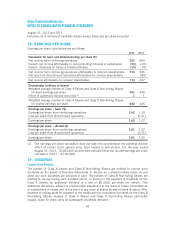
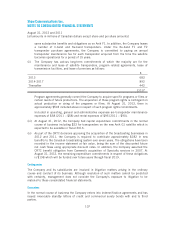
18. EARNINGS PER SHARE
Earnings per share calculations are as follows:
2012 2011
Numerator for basic and diluted earnings per share ($)
Net income from continuing operations 761 559
Deduct: net income attributable to non-controlling interests in subsidiaries (33) (19)
Deduct: dividends on Series A Preferred Shares (15) (4)
Net income from continuing operations attributable to common shareholders 713 536
Net loss from discontinued operations attributable to common shareholders –(89)
Net income attributable to common shareholders 713 447
Denominator (millions of shares)
Weighted average number of Class A Shares and Class B Non-Voting Shares
for basic earnings per share 441 435
Effect of potentially dilutive securities(1) 11
Weighted average number of Class A Shares and Class B Non-Voting Shares
for diluted earnings per share 442 436
Earnings per share – basic ($)
Earnings per share from continuing operations 1.62 1.23
Loss per share from discontinued operations –(0.21)
Earnings per share 1.62 1.02
Earnings per share – diluted ($)
Earnings per share from continuing operations 1.61 1.23
Loss per share from discontinued operations –(0.21)
Earnings per share 1.61 1.02
(1) The earnings per share calculation does not take into consideration the potential dilutive
effect of certain stock options since their impact is anti-dilutive. For the year ended
August 31, 2012, 12,083,206 options were excluded from the diluted earnings per share
calculation (2011 – 8,100,404).
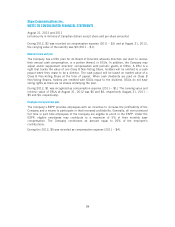
19. DIVIDENDS
Common share dividends
The holders of Class A Shares and Class B Non-Voting Shares are entitled to receive such
dividends as the Board of Directors determines to declare on a share-for-share basis, as and
when any such dividends are declared or paid. The holders of Class B Non-Voting Shares are
entitled to receive during each dividend period, in priority to the payment of dividends on the
Class A Shares, an additional dividend at a rate of $0.0025 per share per annum. This
additional dividend is subject to proportionate adjustment in the event of future consolidations
or subdivisions of shares and in the event of any issue of shares by way of stock dividend. After
payment or setting aside for payment of the additional non-cumulative dividends on the Class B
Non-Voting Shares, holders of Class A Shares and Class B Non-Voting Shares participate
equally, share for share, as to all subsequent dividends declared.
99