Shaw 2012 Annual Report Download - page 110
Download and view the complete annual report
Please find page 110 of the 2012 Shaw annual report below. You can navigate through the pages in the report by either clicking on the pages listed below, or by using the keyword search tool below to find specific information within the annual report.-
 1
1 -
2
-
3
-
4
-
5
-
6
-
7
-
8
-
9
-
10
-
11
-
12
-
13
-
14
-
15
-
16
-
17
-
18
-
19
-
20
-
21
-
22
-
23
-
24
-
25
-
26
-
27
-
28
-
29
-
30
-
31
-
32
-
33
-
34
-
35
-
36
-
37
-
38
-
39
-
40
-
41
-
42
-
43
-
44
-
45
-
46
-
47
-
48
-
49
-
50
-
51
-
52
-
53
-
54
-
55
-
56
-
57
-
58
-
59
-
60
-
61
-
62
-
63
-
64
-
65
-
66
-
67
-
68
-
69
-
70
-
71
-
72
-
73
-
74
-
75
-
76
-
77
-
78
-
79
-
80
-
81
-
82
-
83
-
84
-
85
-
86
-
87
-
88
-
89
-
90
-
91
-
92
-
93
-
94
-
95
-
96
-
97
-
98
-
99
-
 100
100 -
 101
101 -
 102
102 -
 103
103 -
 104
104 -
 105
105 -
 106
106 -
 107
107 -
 108
108 -
 109
109 -
 110
110 -
 111
111 -
 112
112 -
 113
113 -
 114
114 -
 115
115 -
 116
116 -
 117
117 -
 118
118 -
 119
119 -
 120
120 -
121
-
122
-
123
-
124
-
125
-
126
-
127
-
128
-
129
-
130
-
131
-
132
-
133
-
134
 |
 |

Shaw Communications Inc.
NOTES TO CONSOLIDATED FINANCIAL STATEMENTS
August 31, 2012 and 2011
[all amounts in millions of Canadian dollars except share and per share amounts]
2011
Satellite
Cable
$
Media
$
DTH
$
Satellite
Services
$
Total
$
Intersegment
eliminations
$
Total
$
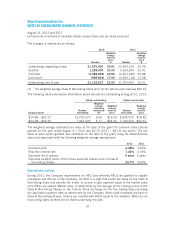
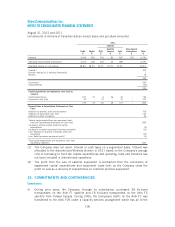
Revenue 3,096 891 745 82 827 (73) 4,741
Operating income before amortization 1,510 252 246 43 289 – 2,051
Operating income as % of revenue 48.8% 28.3% 33.0% 52.4% 34.9% – 43.3%
Interest(1) 312
Burrard Landing Lot 2 Holdings Partnership 1
Wireless 19
332
Cash taxes(1) 240
Corporate/other (20)
220
Capital expenditures and equipment costs (net) by
segment
Capital expenditures 677 27 6 26 32 – 736
Equipment costs (net) 32 – 75 – 75 – 107
709 27 81 26 107 – 843
Reconciliation to Consolidated Statements of Cash
Flows
Additions to property, plant and equipment 705
Additions to equipment costs (net) 120
Additions to other intangibles 65
Total of capital expenditures and equipment costs
(net) per Consolidated Statements of Cash Flows 890
Increase in working capital related to capital
expenditures (4)
Increase in customer equipment financing receivables (13)
Less: Proceeds on disposal of property, plant and
equipment (27)
Less: Satellite services equipment profit(2) (3)
Total capital expenditures and equipment costs (net)
reported by segments 843
(1) The Company does not report interest or cash taxes on a segmented basis. Interest was
allocated to the discontinued Wireless division in 2011 based on the Company’s average
cost of borrowing to fund the capital expenditures and operating costs and therefore has
not been included in discontinued operations.
(2) The profit from the sale of satellite equipment is subtracted from the calculation of
segmented capital expenditures and equipment costs (net) as the Company views the
profit on sale as a recovery of expenditures on customer premise equipment.
25. COMMITMENTS AND CONTINGENCIES
Commitments
(i) During prior years, the Company, through its subsidiaries, purchased 28 Ku-band
transponders on the Anik F1 satellite and 18 Ku-band transponders on the Anik F2
satellite from Telesat Canada. During 2006, the Company’s traffic on the Anik F1 was
transferred to the Anik F1R under a capacity services arrangement which has all of the
106