Shaw 2012 Annual Report Download - page 50
Download and view the complete annual report
Please find page 50 of the 2012 Shaw annual report below. You can navigate through the pages in the report by either clicking on the pages listed below, or by using the keyword search tool below to find specific information within the annual report.-
 1
1 -
2
-
3
-
4
-
5
-
6
-
7
-
8
-
9
-
10
-
11
-
12
-
13
-
14
-
15
-
16
-
17
-
18
-
19
-
20
-
21
-
22
-
23
-
24
-
25
-
26
-
27
-
28
-
29
-
30
-
31
-
32
-
33
-
34
-
35
-
36
-
37
-
38
-
39
-
 40
40 -
 41
41 -
 42
42 -
 43
43 -
 44
44 -
 45
45 -
 46
46 -
 47
47 -
 48
48 -
 49
49 -
 50
50 -
 51
51 -
 52
52 -
 53
53 -
 54
54 -
 55
55 -
 56
56 -
 57
57 -
 58
58 -
 59
59 -
 60
60 -
61
-
62
-
63
-
64
-
65
-
66
-
67
-
68
-
69
-
70
-
71
-
72
-
73
-
74
-
75
-
76
-
77
-
78
-
79
-
80
-
81
-
82
-
83
-
84
-
85
-
86
-
87
-
88
-
89
-
90
-
91
-
92
-
93
-
94
-
95
-
96
-
97
-
98
-
99
-
100
-
101
-
102
-
103
-
104
-
105
-
106
-
107
-
108
-
109
-
110
-
111
-
112
-
113
-
114
-
115
-
116
-
117
-
118
-
119
-
120
-
121
-
122
-
123
-
124
-
125
-
126
-
127
-
128
-
129
-
130
-
131
-
132
-
133
-
134
 |
 |

Shaw Communications Inc.
MANAGEMENT’S DISCUSSION AND ANALYSIS
August 31, 2012
(In $millions Cdn)
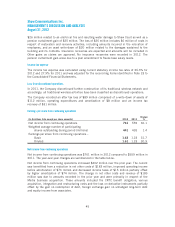
Increased operating income before amortization 76
Increased amortization (74)
Decreased interest expense 2
Change in other net costs and revenue(1) 183
Decreased income taxes 15
202
(1) Other net costs and revenue include gain on redemption of debt, CRTC benefit
obligations, business acquisition, integration and restructuring expenses, gain on
remeasurement of interests in equity investments, gain (loss) on derivative instruments,
accretion of long-term liabilities and provisions, foreign exchange gain on unhedged long-
term debt, equity income from associates and other gains as detailed in the Consolidated
Statements of Income.
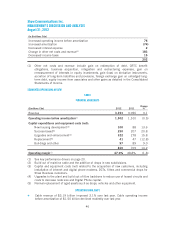
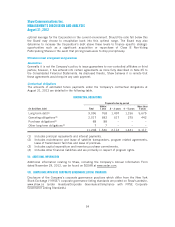
SEGMENTED OPERATIONS REVIEW
CABLE
FINANCIAL HIGHLIGHTS
($millions Cdn) 2012 2011
Change
%
Revenue 3,193 3,096 3.1
Operating income before amortization(1) 1,502 1,510 (0.5)
Capital expenditures and equipment costs (net):
New housing development(2) 100 88 13.6
Success-based(3) 250 207 20.8
Upgrades and enhancement(4) 322 278 15.8
Replacement(5) 41 47 (12.8)
Buildings and other 97 89 9.0
810 709 14.2
Operating margin(1) 47.0% 48.8% (1.8)
(1) See key performance drivers on page 20.
(2) Build out of mainline cable and the addition of drops in new subdivisions.
(3) Capital and equipment costs (net) related to the acquisition of new customers, including
installation of internet and digital phone modems, DCTs, filters and commercial drops for
Shaw Business customers.
(4) Upgrades to the plant and build out of fibre backbone to reduce use of leased circuits and
costs to decrease node size and Digital Phone capital.
(5) Normal replacement of aged assets such as drops, vehicles and other equipment.
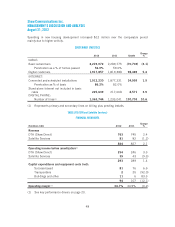
OPERATING HIGHLIGHTS
ŠCable revenue of $3.19 billion improved 3.1% over last year. Cable operating income
before amortization of $1.50 billion declined modestly over last year.
46