Shaw 2012 Annual Report Download - page 131
Download and view the complete annual report
Please find page 131 of the 2012 Shaw annual report below. You can navigate through the pages in the report by either clicking on the pages listed below, or by using the keyword search tool below to find specific information within the annual report.-
 1
1 -
2
-
3
-
4
-
5
-
6
-
7
-
8
-
9
-
10
-
11
-
12
-
13
-
14
-
15
-
16
-
17
-
18
-
19
-
20
-
21
-
22
-
23
-
24
-
25
-
26
-
27
-
28
-
29
-
30
-
31
-
32
-
33
-
34
-
35
-
36
-
37
-
38
-
39
-
40
-
41
-
42
-
43
-
44
-
45
-
46
-
47
-
48
-
49
-
50
-
51
-
52
-
53
-
54
-
55
-
56
-
57
-
58
-
59
-
60
-
61
-
62
-
63
-
64
-
65
-
66
-
67
-
68
-
69
-
70
-
71
-
72
-
73
-
74
-
75
-
76
-
77
-
78
-
79
-
80
-
81
-
82
-
83
-
84
-
85
-
86
-
87
-
88
-
89
-
90
-
91
-
92
-
93
-
94
-
95
-
96
-
97
-
98
-
99
-
100
-
101
-
102
-
103
-
104
-
105
-
106
-
107
-
108
-
109
-
110
-
111
-
112
-
113
-
114
-
115
-
116
-
117
-
118
-
119
-
120
-
 121
121 -
 122
122 -
 123
123 -
 124
124 -
 125
125 -
 126
126 -
 127
127 -
 128
128 -
 129
129 -
 130
130 -
 131
131 -
 132
132 -
 133
133 -
 134
134
 |
 |

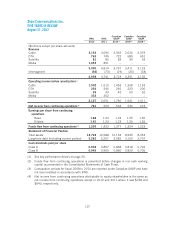
Shaw Communications Inc.
FIVE YEARS IN REVIEW
August 31, 2012
IFRS IFRS
Canadian
GAAP
Canadian
GAAP
Canadian
GAAP
2012 2011 2010(3) 2009(3) 2008(3)
($millions except per share amounts)
Revenue
Cable 3,193 3,096 2,932 2,636 2,379
DTH 763 745 722 685 651
Satellite 81 82 83 90 93
Media 1,053 891 – – –
5,090 4,814 3,737 3,411 3,123
Intersegment (92) (73) (19) (20) (18)
4,998 4,741 3,718 3,391 3,105
Operating income before amortization(1)
Cable 1,502 1,510 1,453 1,268 1,153
DTH 254 246 265 223 206
Satellite 39 43 42 50 52
Media 332 252 – – –
2,127 2,051 1,760 1,541 1,411
Net income from continuing operations(4) 761 559 534 536 673
Earnings per share from continuing
operations
Basic 1.62 1.23 1.23 1.25 1.56
Diluted 1.61 1.23 1.23 1.25 1.55
Funds flow from continuing operations(2) 1,299 1,433 1,377 1,324 1,223
Statement of Financial Position
Total assets 12,722 12,588 10,154 8,935 8,353
Long-term debt (including current portion) 5,263 5,257 3,982 3,150 2,707
Cash dividends paid per share
Class A 0.942 0.897 0.858 0.818 0.702
Class B 0.945 0.900 0.860 0.820 0.705
(1) See key performance drivers on page 20.
(2) Funds flow from continuing operations is presented before changes in non-cash working
capital as presented in the Consolidated Statements of Cash Flows.
(3) Comparative periods for fiscal 2008 to 2010 are reported under Canadian GAAP and have
not been restated in accordance with IFRS.
(4) Net income from continuing operations attributable to equity shareholders is the same as
net income from continuing operations except in 2012 and 2011 where it was $728 and
$540, respectively.
127