Shaw 2012 Annual Report Download - page 54
Download and view the complete annual report
Please find page 54 of the 2012 Shaw annual report below. You can navigate through the pages in the report by either clicking on the pages listed below, or by using the keyword search tool below to find specific information within the annual report.-
 1
1 -
2
-
3
-
4
-
5
-
6
-
7
-
8
-
9
-
10
-
11
-
12
-
13
-
14
-
15
-
16
-
17
-
18
-
19
-
20
-
21
-
22
-
23
-
24
-
25
-
26
-
27
-
28
-
29
-
30
-
31
-
32
-
33
-
34
-
35
-
36
-
37
-
38
-
39
-
40
-
41
-
42
-
43
-
 44
44 -
 45
45 -
 46
46 -
 47
47 -
 48
48 -
 49
49 -
 50
50 -
 51
51 -
 52
52 -
 53
53 -
 54
54 -
 55
55 -
 56
56 -
 57
57 -
 58
58 -
 59
59 -
 60
60 -
 61
61 -
 62
62 -
 63
63 -
 64
64 -
65
-
66
-
67
-
68
-
69
-
70
-
71
-
72
-
73
-
74
-
75
-
76
-
77
-
78
-
79
-
80
-
81
-
82
-
83
-
84
-
85
-
86
-
87
-
88
-
89
-
90
-
91
-
92
-
93
-
94
-
95
-
96
-
97
-
98
-
99
-
100
-
101
-
102
-
103
-
104
-
105
-
106
-
107
-
108
-
109
-
110
-
111
-
112
-
113
-
114
-
115
-
116
-
117
-
118
-
119
-
120
-
121
-
122
-
123
-
124
-
125
-
126
-
127
-
128
-
129
-
130
-
131
-
132
-
133
-
134
 |
 |
Shaw Communications Inc.
MANAGEMENT’S DISCUSSION AND ANALYSIS
August 31, 2012
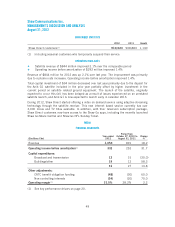
OPERATING HIGHLIGHTS
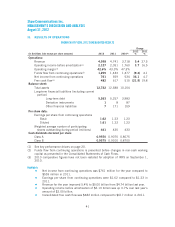
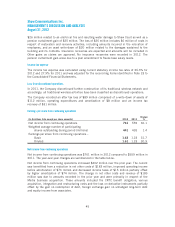
Revenue and operating income before amortization for the year were $1.05 billion and $332
million, respectively, compared to $891 million and $252 million for the prior year period from
October 27, 2010 to August 31, 2011. For informational purposes, on a comparative basis to
the full twelve months ended August 31, 2011, Media revenues were down 2% reflecting
softness in the advertising market as a result of continued economic uncertainty. Operating
income before amortization increased 2%, as lower programming costs in 2012 more than
offset the reduced advertising revenues.
During the year, Global delivered solid programming results led by the strength of Big Brother,
Hotel Hell and Rookie Blue. The Media specialty portfolio also led in the channel rankings in
the adult 25-54 category, with 4 of the Top 10 analog services, including History as the top
entertainment network in Canada, and 5 of the Top 10 digital services, with National
Geographic as the leading digital channel. During late 2012 Shaw Media launched Lifetime,
H2 and National Geographic Wild.
In News, Global is in the number one position in all three major western markets with ratings
up for the majority of all news programs. Global Toronto News Hour moved into the number two
position and the station also delivered solid audience growth in the News Hour Final. The West
Block with Tom Clark continued to perform well, beginning its second season as Canada’s most
watched political talk show.
The conventional fall programming premiered throughout the month of September with a solid
returning line-up and new drama programming including Vegas, Chicago Fire, Last Resort and
Elementary. Shaw Media also added several new comedies to the fall schedule including Go On
and Guys With Kids.
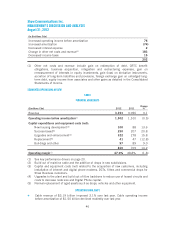
Capital investment continued on various projects and included upgrading production
equipment, infrastructure and facility investments.
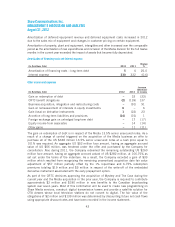
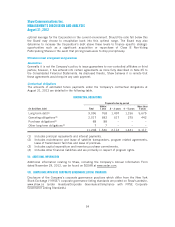
IV. FINANCIAL POSITION
Total assets at August 31, 2012 were $12.7 billion compared to $12.6 billion at August 31,
2011. Following is a discussion of significant changes in the consolidated statement of
financial position since August 31, 2011.
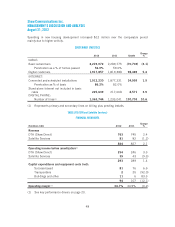
Current assets declined $31 million primarily due to decreases in cash of $16 million, assets
held for sale of $15 million, and accounts receivable of $10 million, the total of which was
partially offset by increased inventories of $5 million and other current assets of $7 million.
Cash decreased as the cash outlay for investing and financing activities exceeded the funds
provided by operations. Assets held for sale decreased as the sale of the wireless assets was
completed during the first quarter and accounts receivable declined due to timing of collection
of miscellaneous receivables. Inventories were higher due to timing of equipment purchases
while other current assets were up primarily as a result of increases in program rights.
Property, plant and equipment increased $42 million as current year capital investment
exceeded amortization and the asset write-down related to the electrical fire and resulting water
damage at Shaw Court.
Other long-term assets were up $73 million primarily due to an increase in deferred equipment
costs and related customer equipment financing receivables.
50